
TL;DR
Complaints about energy suppliers have fallen since the 2022 price crisis but not back to pre-crisis levels, and they are now more about meters, bills and payment than about prices. Complaints to the Belgian federal Energy Ombudsman went from 9,088 in 2021 to a record 26,920 in 2022, and still stood at 10,453 in 2025, above 2018's 6,713. Meters rose from 16.4% to 24.7% of mediation requests between 2021 and 2025. Switching is lower, but 51% of Belgian households (electricity) and 64% (gas) are on one of the 10 most expensive products. This guide covers prices, complaint volumes and mix, payment difficulty, switching and the call signals worth extracting.
In 2022, energy prices exploded and so did complaints. Four years later, prices have come down, but the complaints have not returned to where they were, and their nature has changed. Customers now call less about the price itself and more about meters, bills and payment plans. Each of those calls is also a moment where a customer decides whether to stay.
Key figures
| Figure | Value | Source |
|---|---|---|
| Complaints to the Belgian federal Energy Ombudsman, 2021 → 2022 | 9,088 → 26,920 | Energy Ombudsman; VRT NWS |
| Complaints in 2025 | 10,453 (still above 2018's 6,713) | Energy Ombudsman; BX1 |
| Meters' share of mediation requests, 2021 → 2025 | 16.4% → 24.7% | Energy Ombudsman |
| Belgian household electricity price at the late-2022 peak vs early 2021 | +66% | Eurostat |
| Flemish households switching electricity supplier, 2019 → 2024 | 26.3% → 18.0% | VREG |
| Belgian households on one of the 10 most expensive products (electricity / gas) | 51% / 64% | CREG, Sept 2025 |
| Disputes received by the French energy ombudsman (MNE), 2025 | 28,071 | MNE, via press |
1. The crisis, in prices
Eurostat's household price series for Belgium shows the shock clearly. Electricity for a typical household (2,500–4,999 kWh a year) went from €0.27/kWh in the first half of 2021 to €0.45 in the second half of 2022, all taxes included: +66%. Gas nearly tripled over the same period. Prices fell back from 2023 but remain above their pre-crisis level, and Belgian electricity stayed above the EU average in 2025.
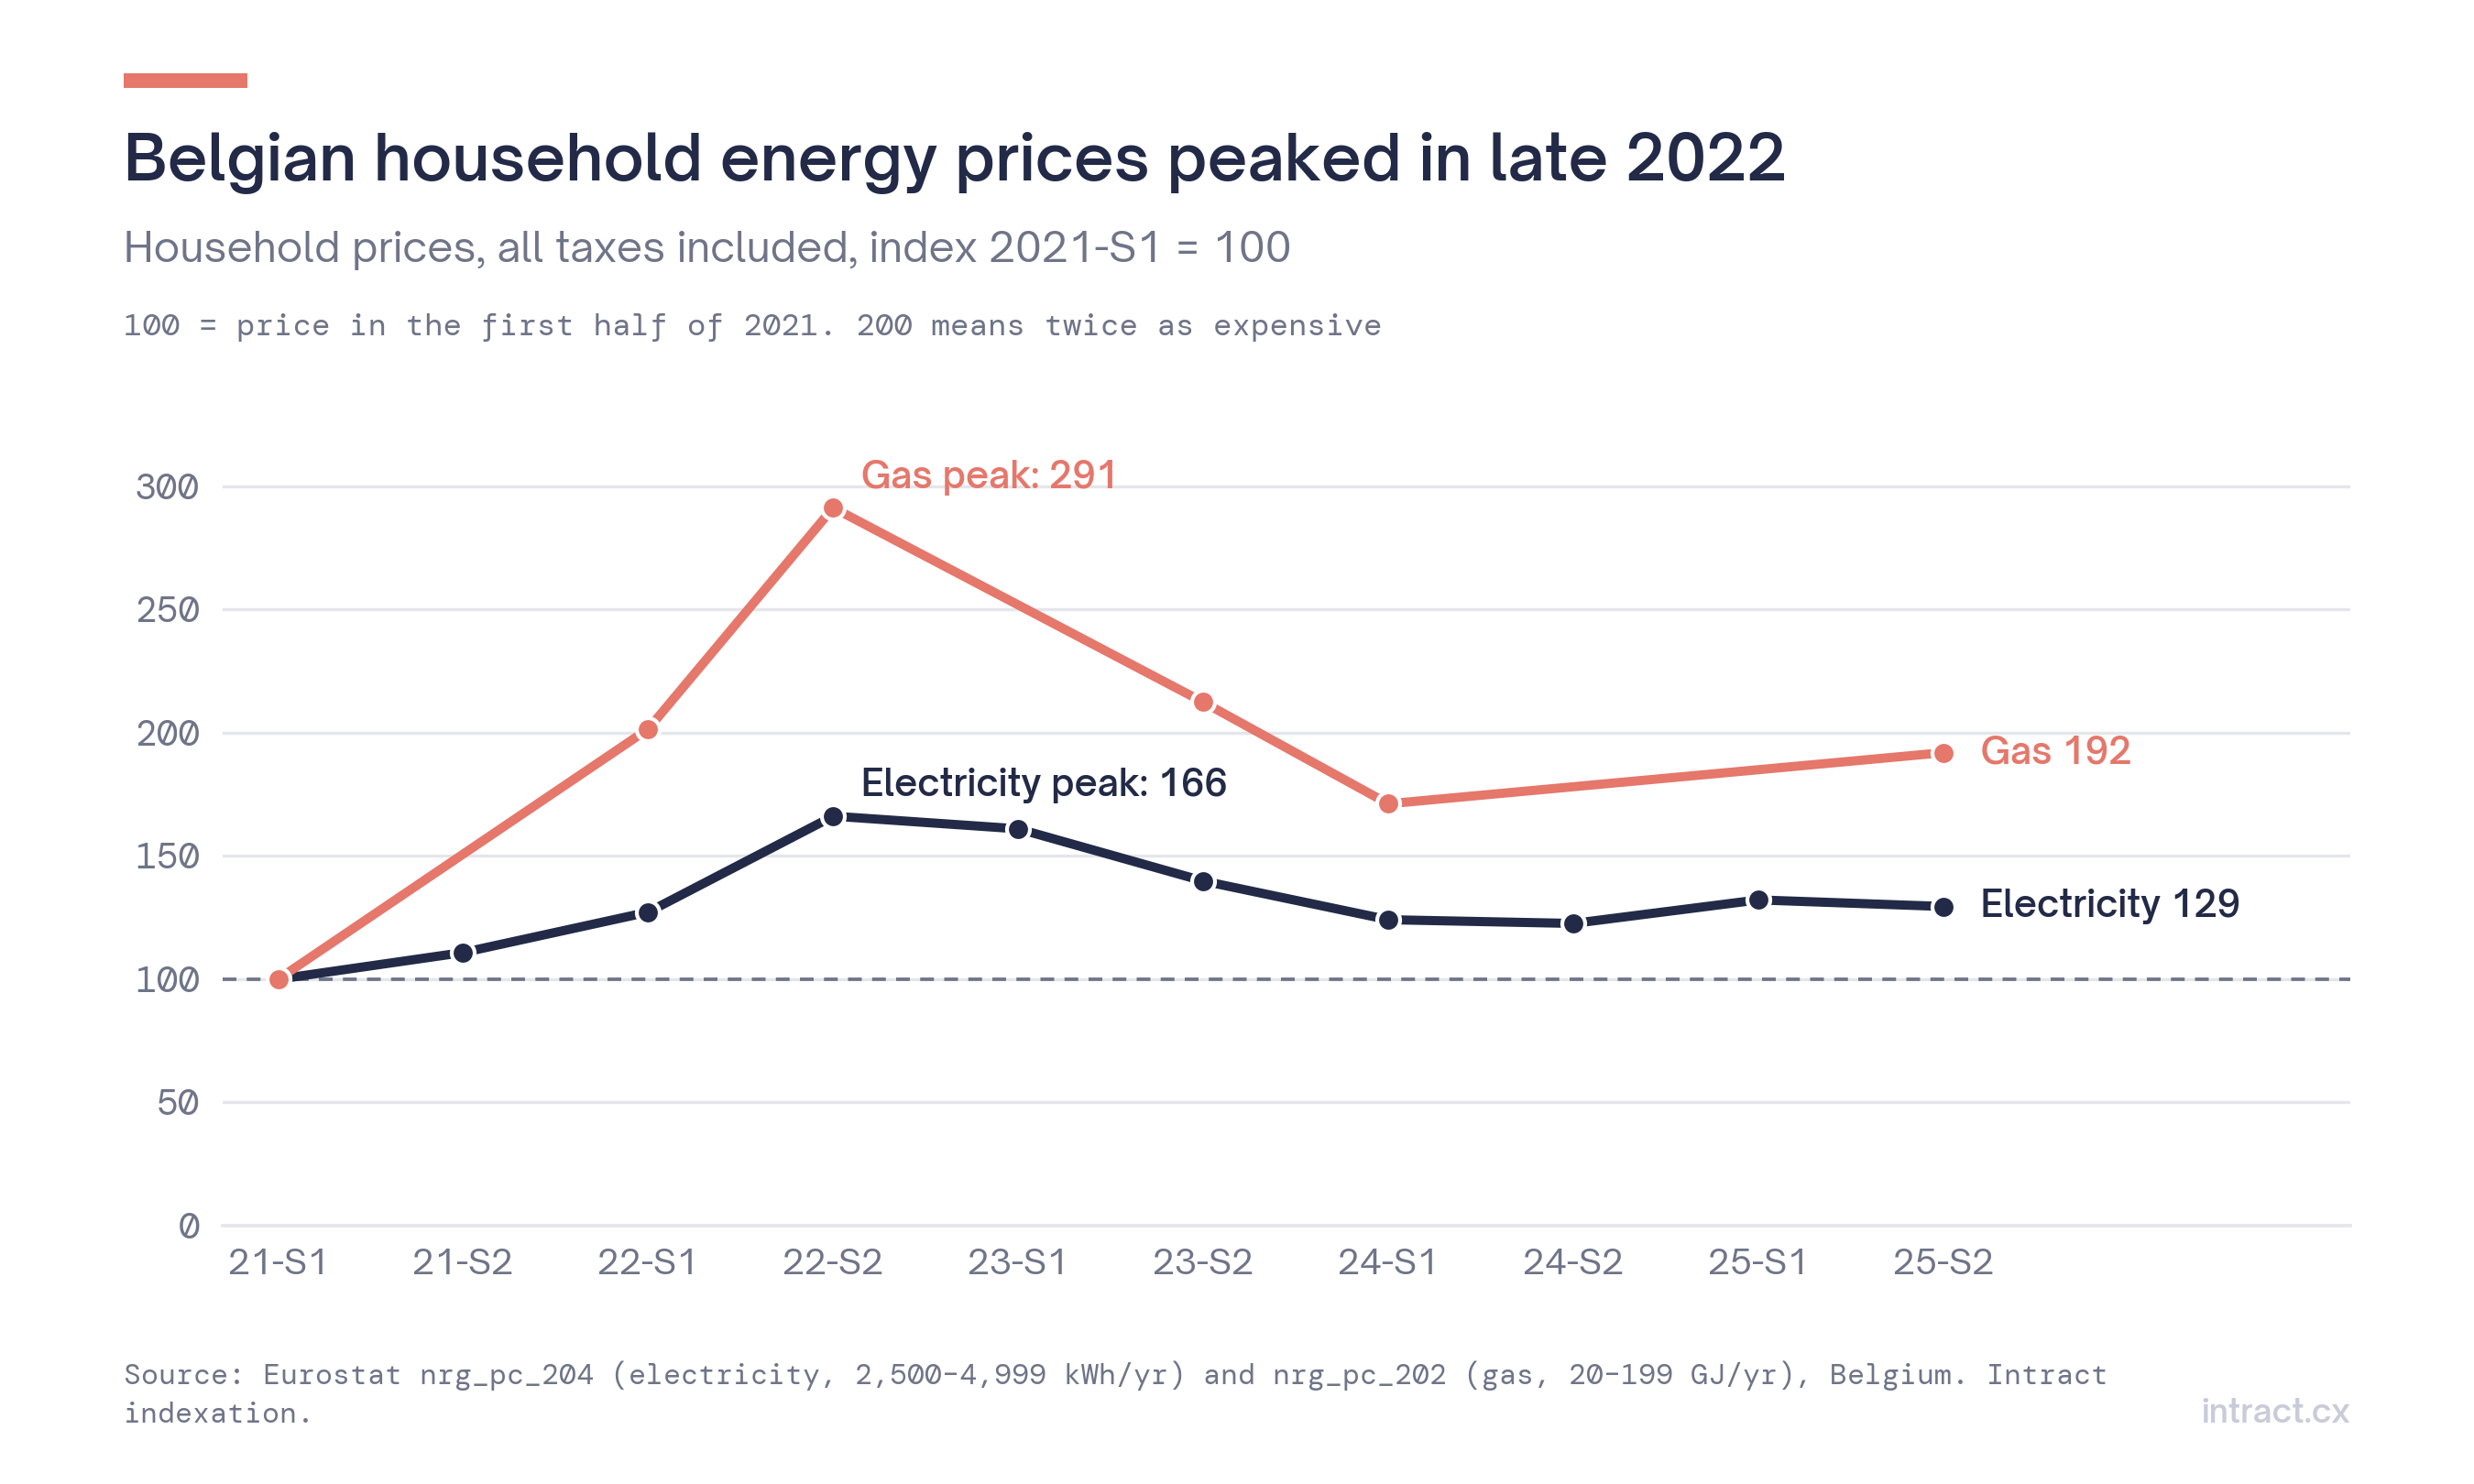 Figure 1. Belgian household electricity and gas prices, index 2021-S1 = 100.
2. The crisis, in complaints
The Belgian federal Energy Ombudsman received 9,088 complaints in 2021, already +36.9% on 2020, then a record 26,920 in 2022. Volumes have fallen since, to 24,615 in 2023, 13,373 in 2024 and 10,453 in 2025, but they remain well above the 6,713 recorded in 2018.
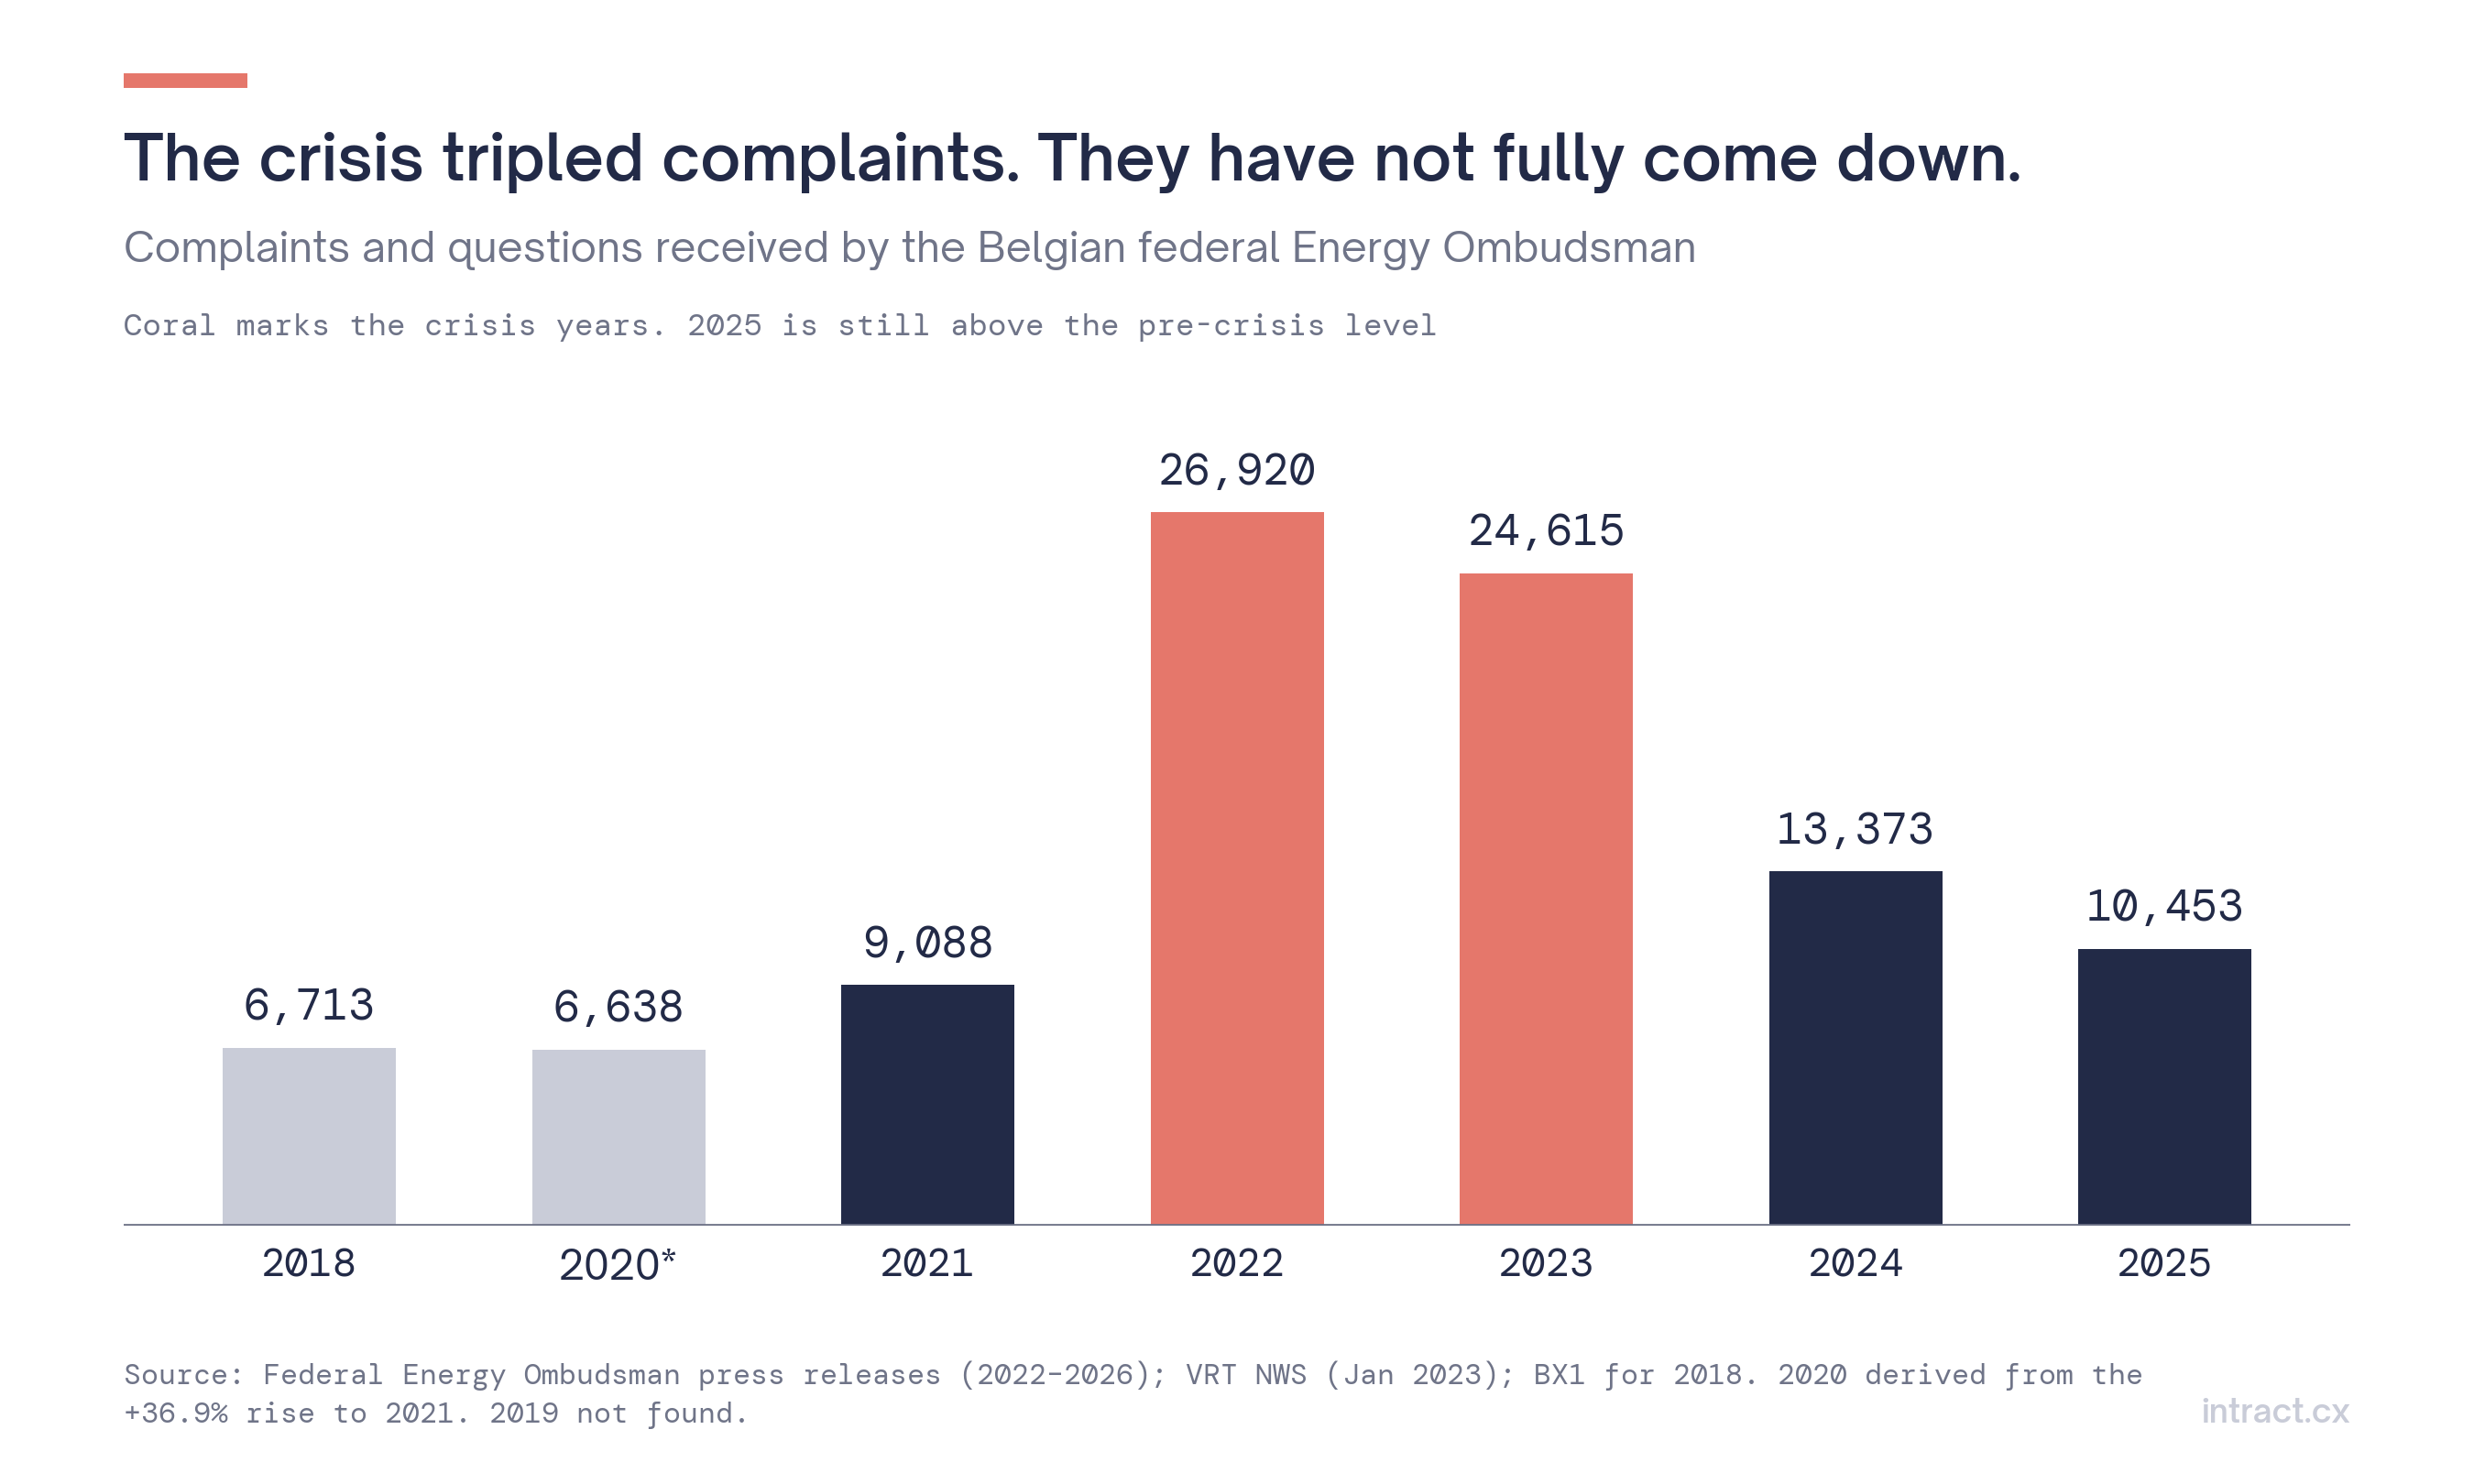 Figure 2. Complaints to the Belgian federal Energy Ombudsman.
Across Europe, ACER's monitoring report found that electricity complaints about billing and debt collection rose 47% in 2022 and complaints about prices doubled. In France, the national energy ombudsman received about 30,600 disputes in both 2021 and 2022 and 28,071 in 2025, with contested consumption the top reason (25%).
3. What customers complain about has changed
The more useful signal is the mix.
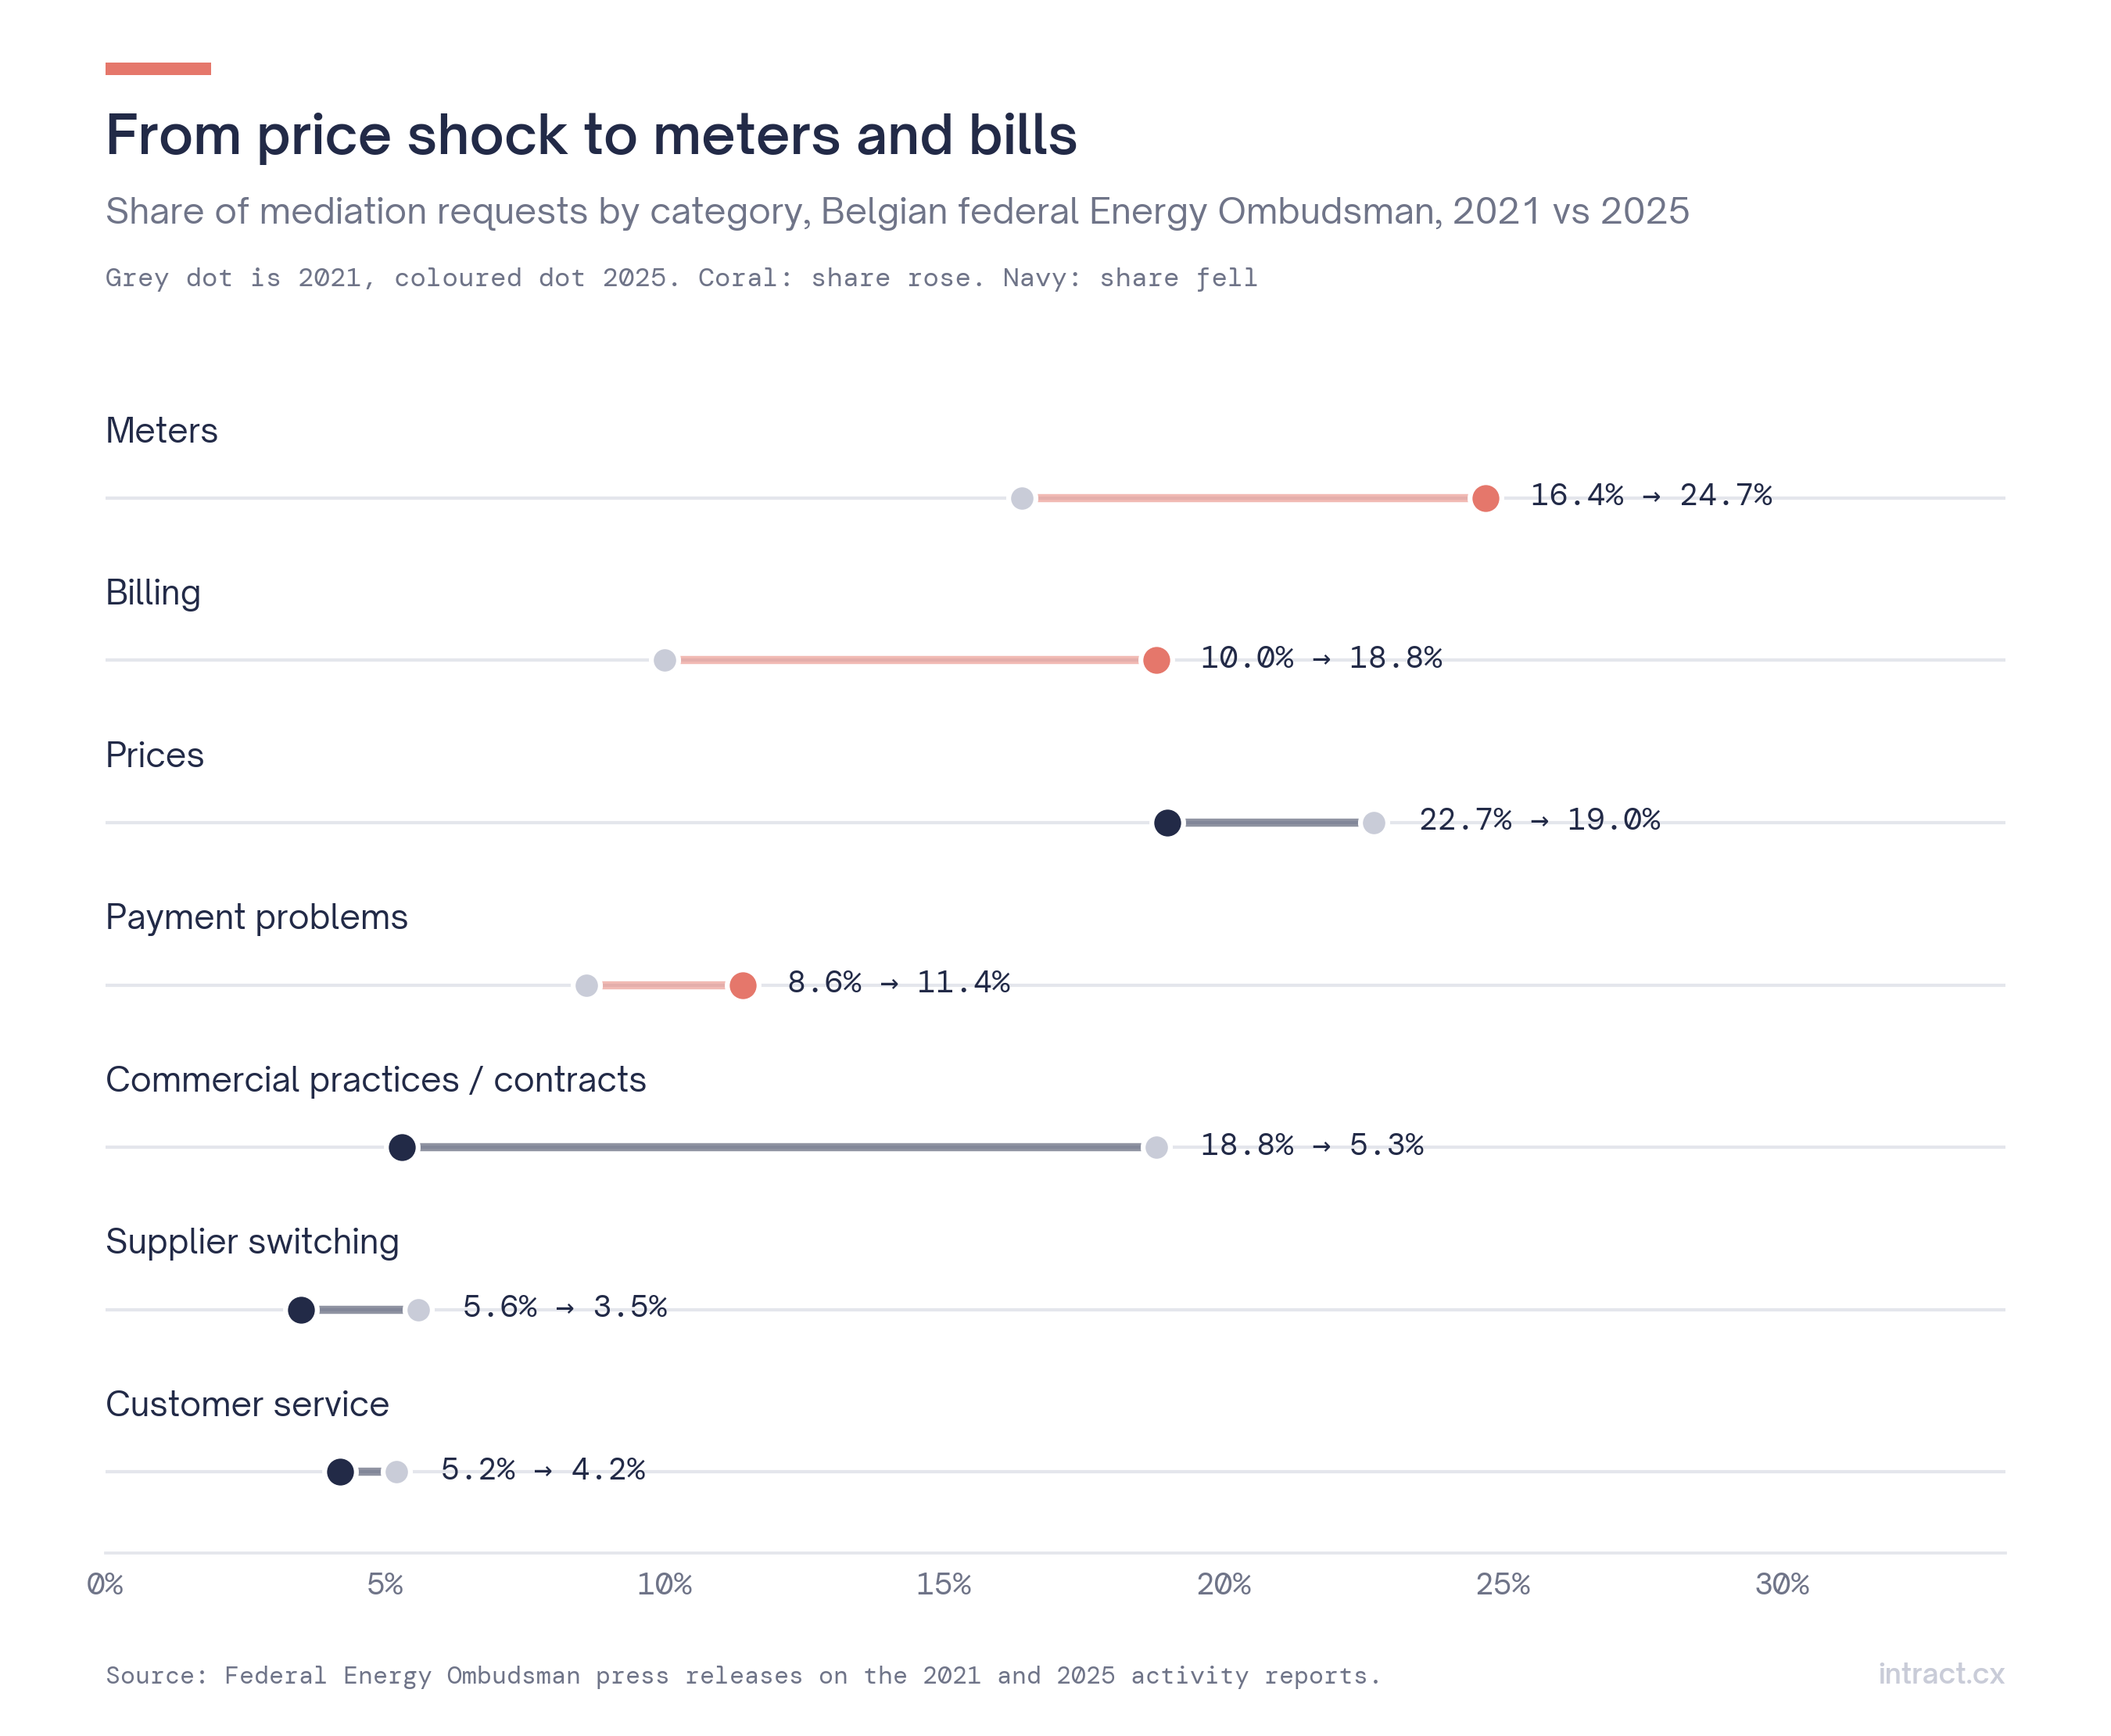 Figure 3. Share of mediation requests by category, 2021 vs 2025.
| Category | 2021 | 2025 | Change |
|---|---|---|---|
| Meters | 16.4% | 24.7% | +8.3 pts |
| Billing | 10.0% | 18.8% | +8.8 pts |
| Prices | 22.7% | 19.0% | −3.7 pts |
| Payment problems | 8.6% | 11.4% | +2.8 pts |
| Commercial practices / contracts | 18.8% | 5.3% | −13.5 pts |
| Supplier switching | 5.6% | 3.5% | −2.1 pts |
| Customer service | 5.2% | 4.2% | −1.0 pt |
In 2021, customers complained about what suppliers were charging and how contracts were sold. In 2025, they complain about how consumption is measured and billed, and about paying. Those are operational issues, often fixable, and almost always discussed on the phone first.
Meters are a structural driver. In Flanders, 74% of households now have a digital meter, up from 14% in 2020; 26% of households are negative about it and 34% feel insufficiently informed. According to the VREG, 3,007 supply points were still blocked for more than six months in October 2024 after data problems in the shared market platform, and moves generated up to four times the pre-2021 level of ombudsman complaints in 2022–2023.
Reachability is now regulated too. In 2024, 5,300 complaints arrived at the ombudsman by phone and had to be resubmitted in writing, and a law of 28 July 2025 sets accessibility rules for supplier customer service from 1 January 2026.
4. Payment difficulty
Price shocks leave a tail. In Wallonia in 2025, 5.6% of electricity customers and 7.6% of gas customers were declared in payment default at least once, 6.8% and 9.7% had a payment plan, and 59,294 electricity prepayment meters were active. In Brussels in 2024, 39% of households received at least one reminder and 16% a formal notice. Eurostat puts Belgian households in arrears on utility bills at 4.0% in 2024–2025, up from 2.8% in 2021.
"Payment problems" rose from 8.6% to 11.4% of ombudsman requests. A call about a payment plan is also a call about vulnerability (see our article on vulnerable customers in collections).
5. Switching: lower, but the risk has not gone
Belgian customers switch a lot by European standards, but less than before the crisis. In Flanders, household switching for electricity fell from 26.3% in 2019 to 18.0% in 2024, and for gas from 28.8% to 19.6%. Brussels is a different market, with electricity switching at 3.05% in 2024, its highest in 15 years.
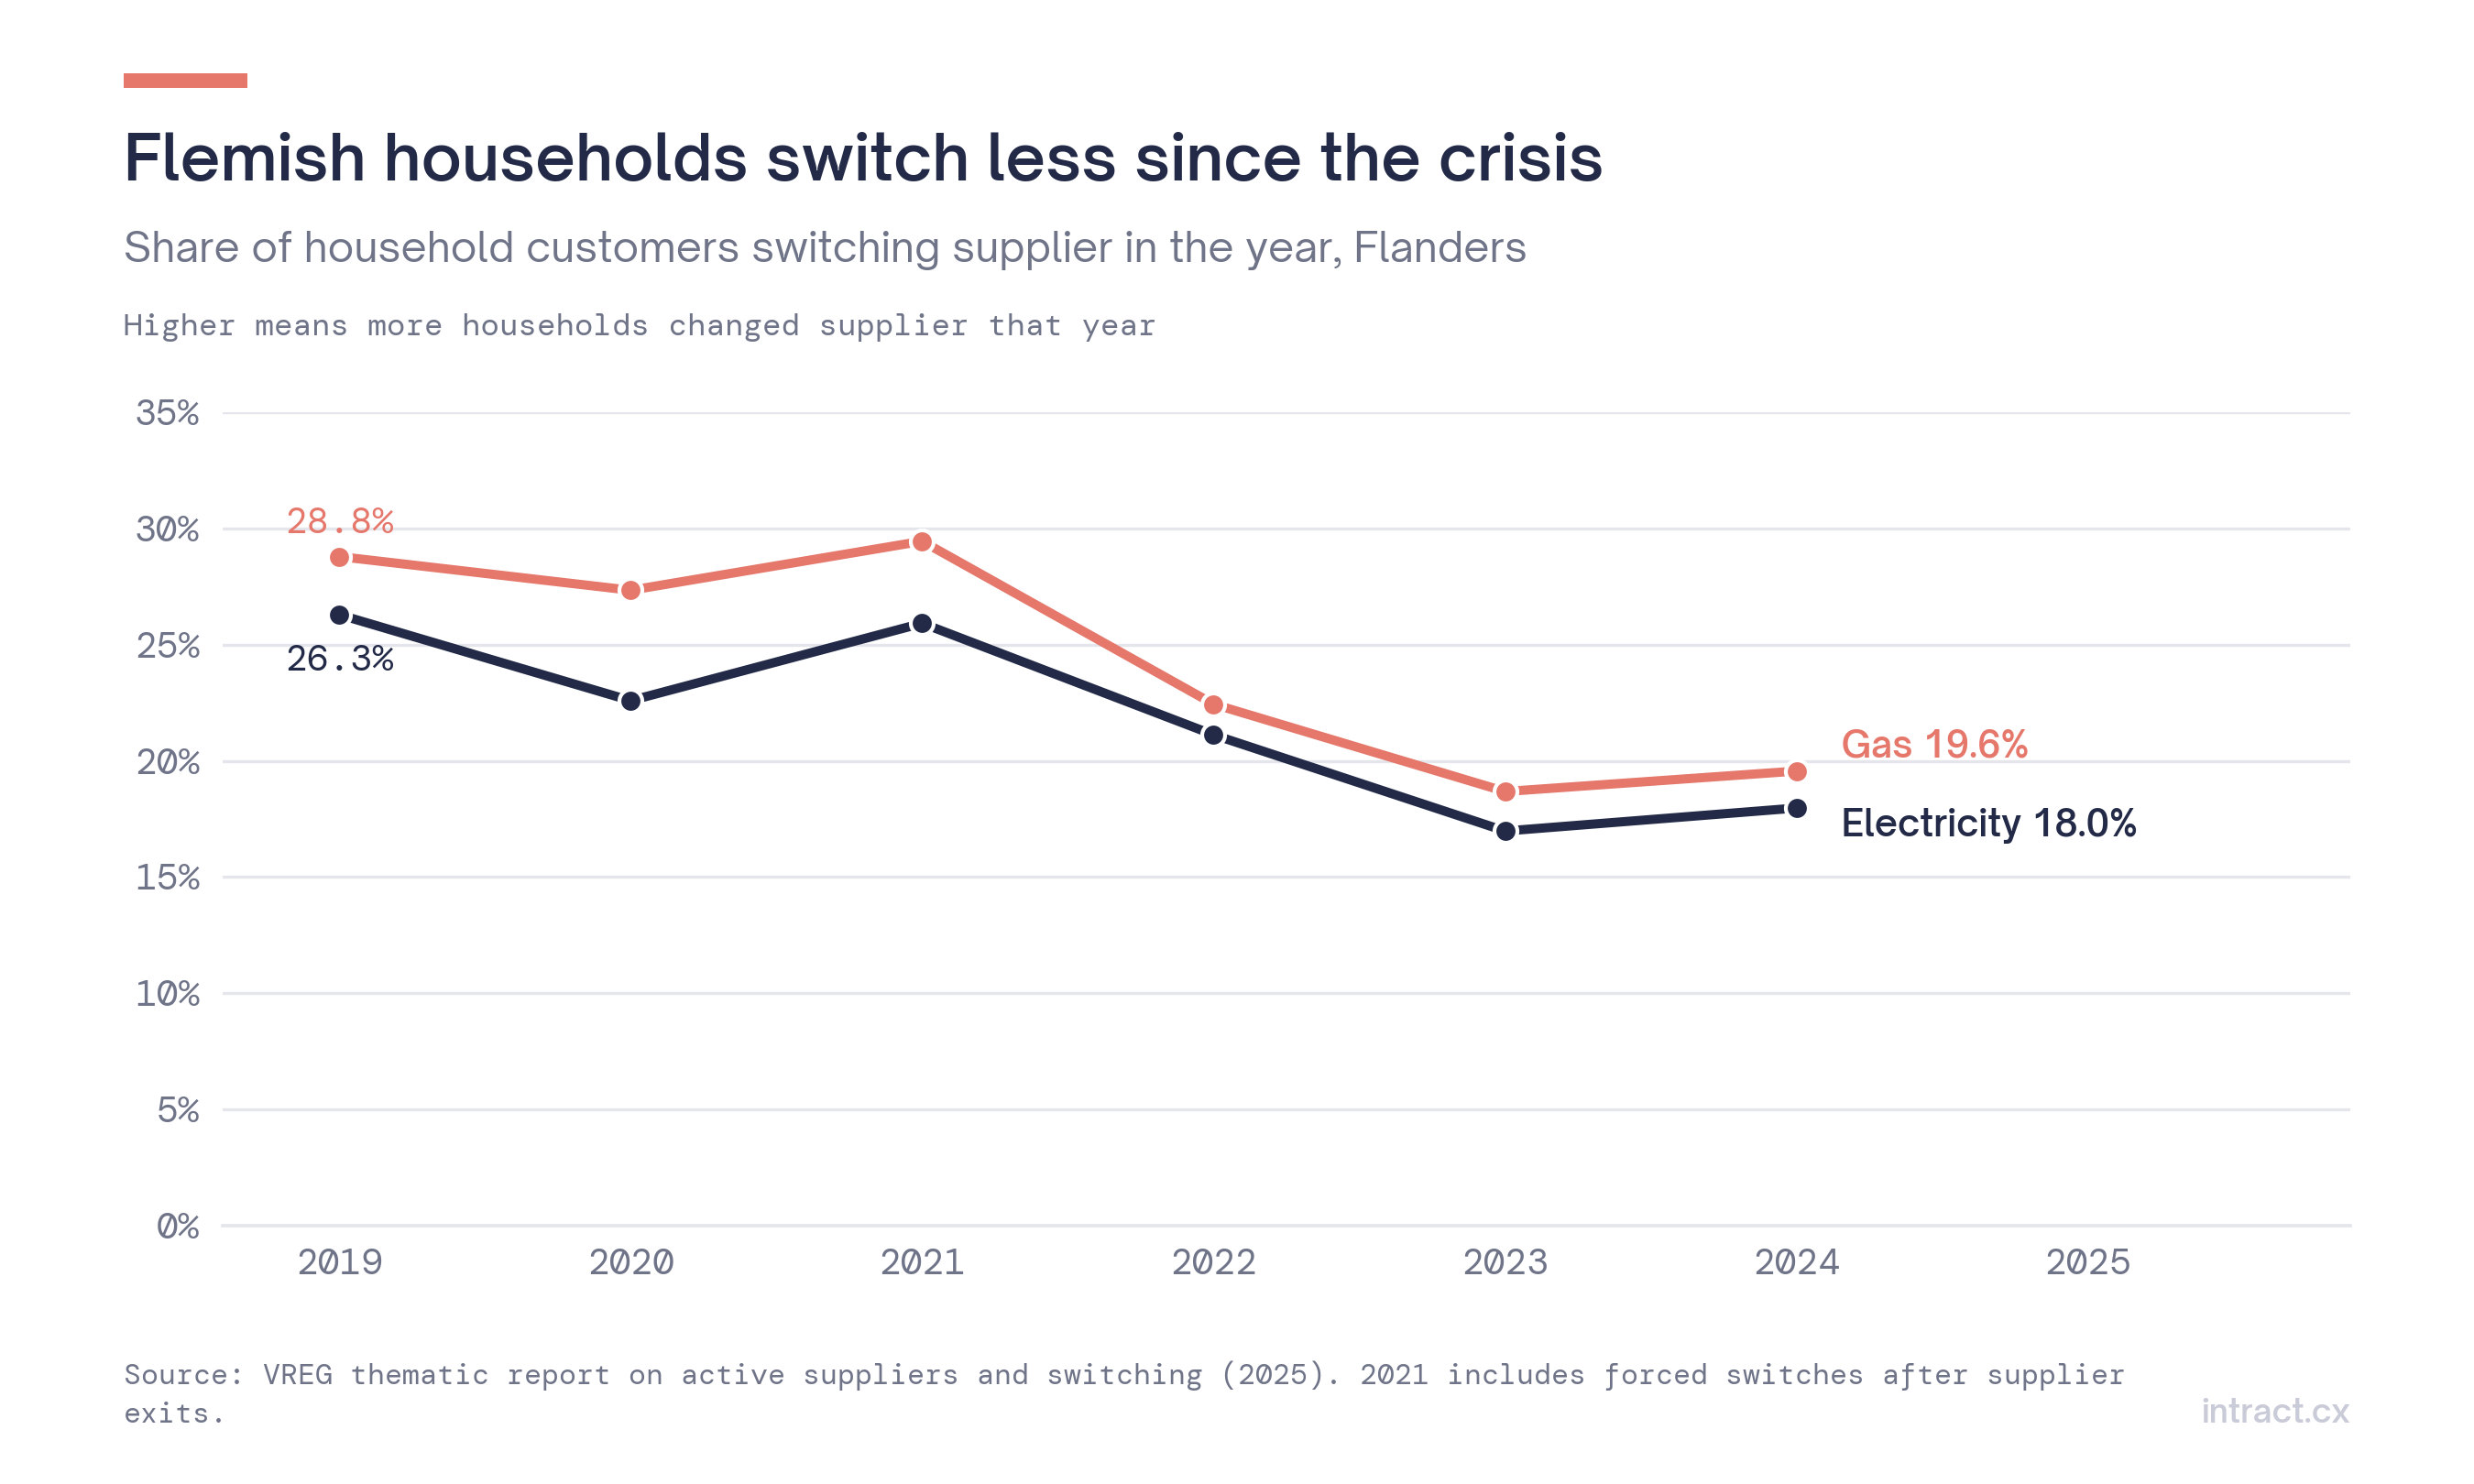 Figure 4. Household switching rates, Flanders.
Lower switching does not mean loyalty. The VREG's 2025 market monitor found that 33% of Flemish households are considering switching, and the CREG found that 51% of households (electricity) and 64% (gas) are on one of the 10 most expensive products, with average potential savings of about €130 and €170 a year. Those customers are one comparison-site visit away from leaving.
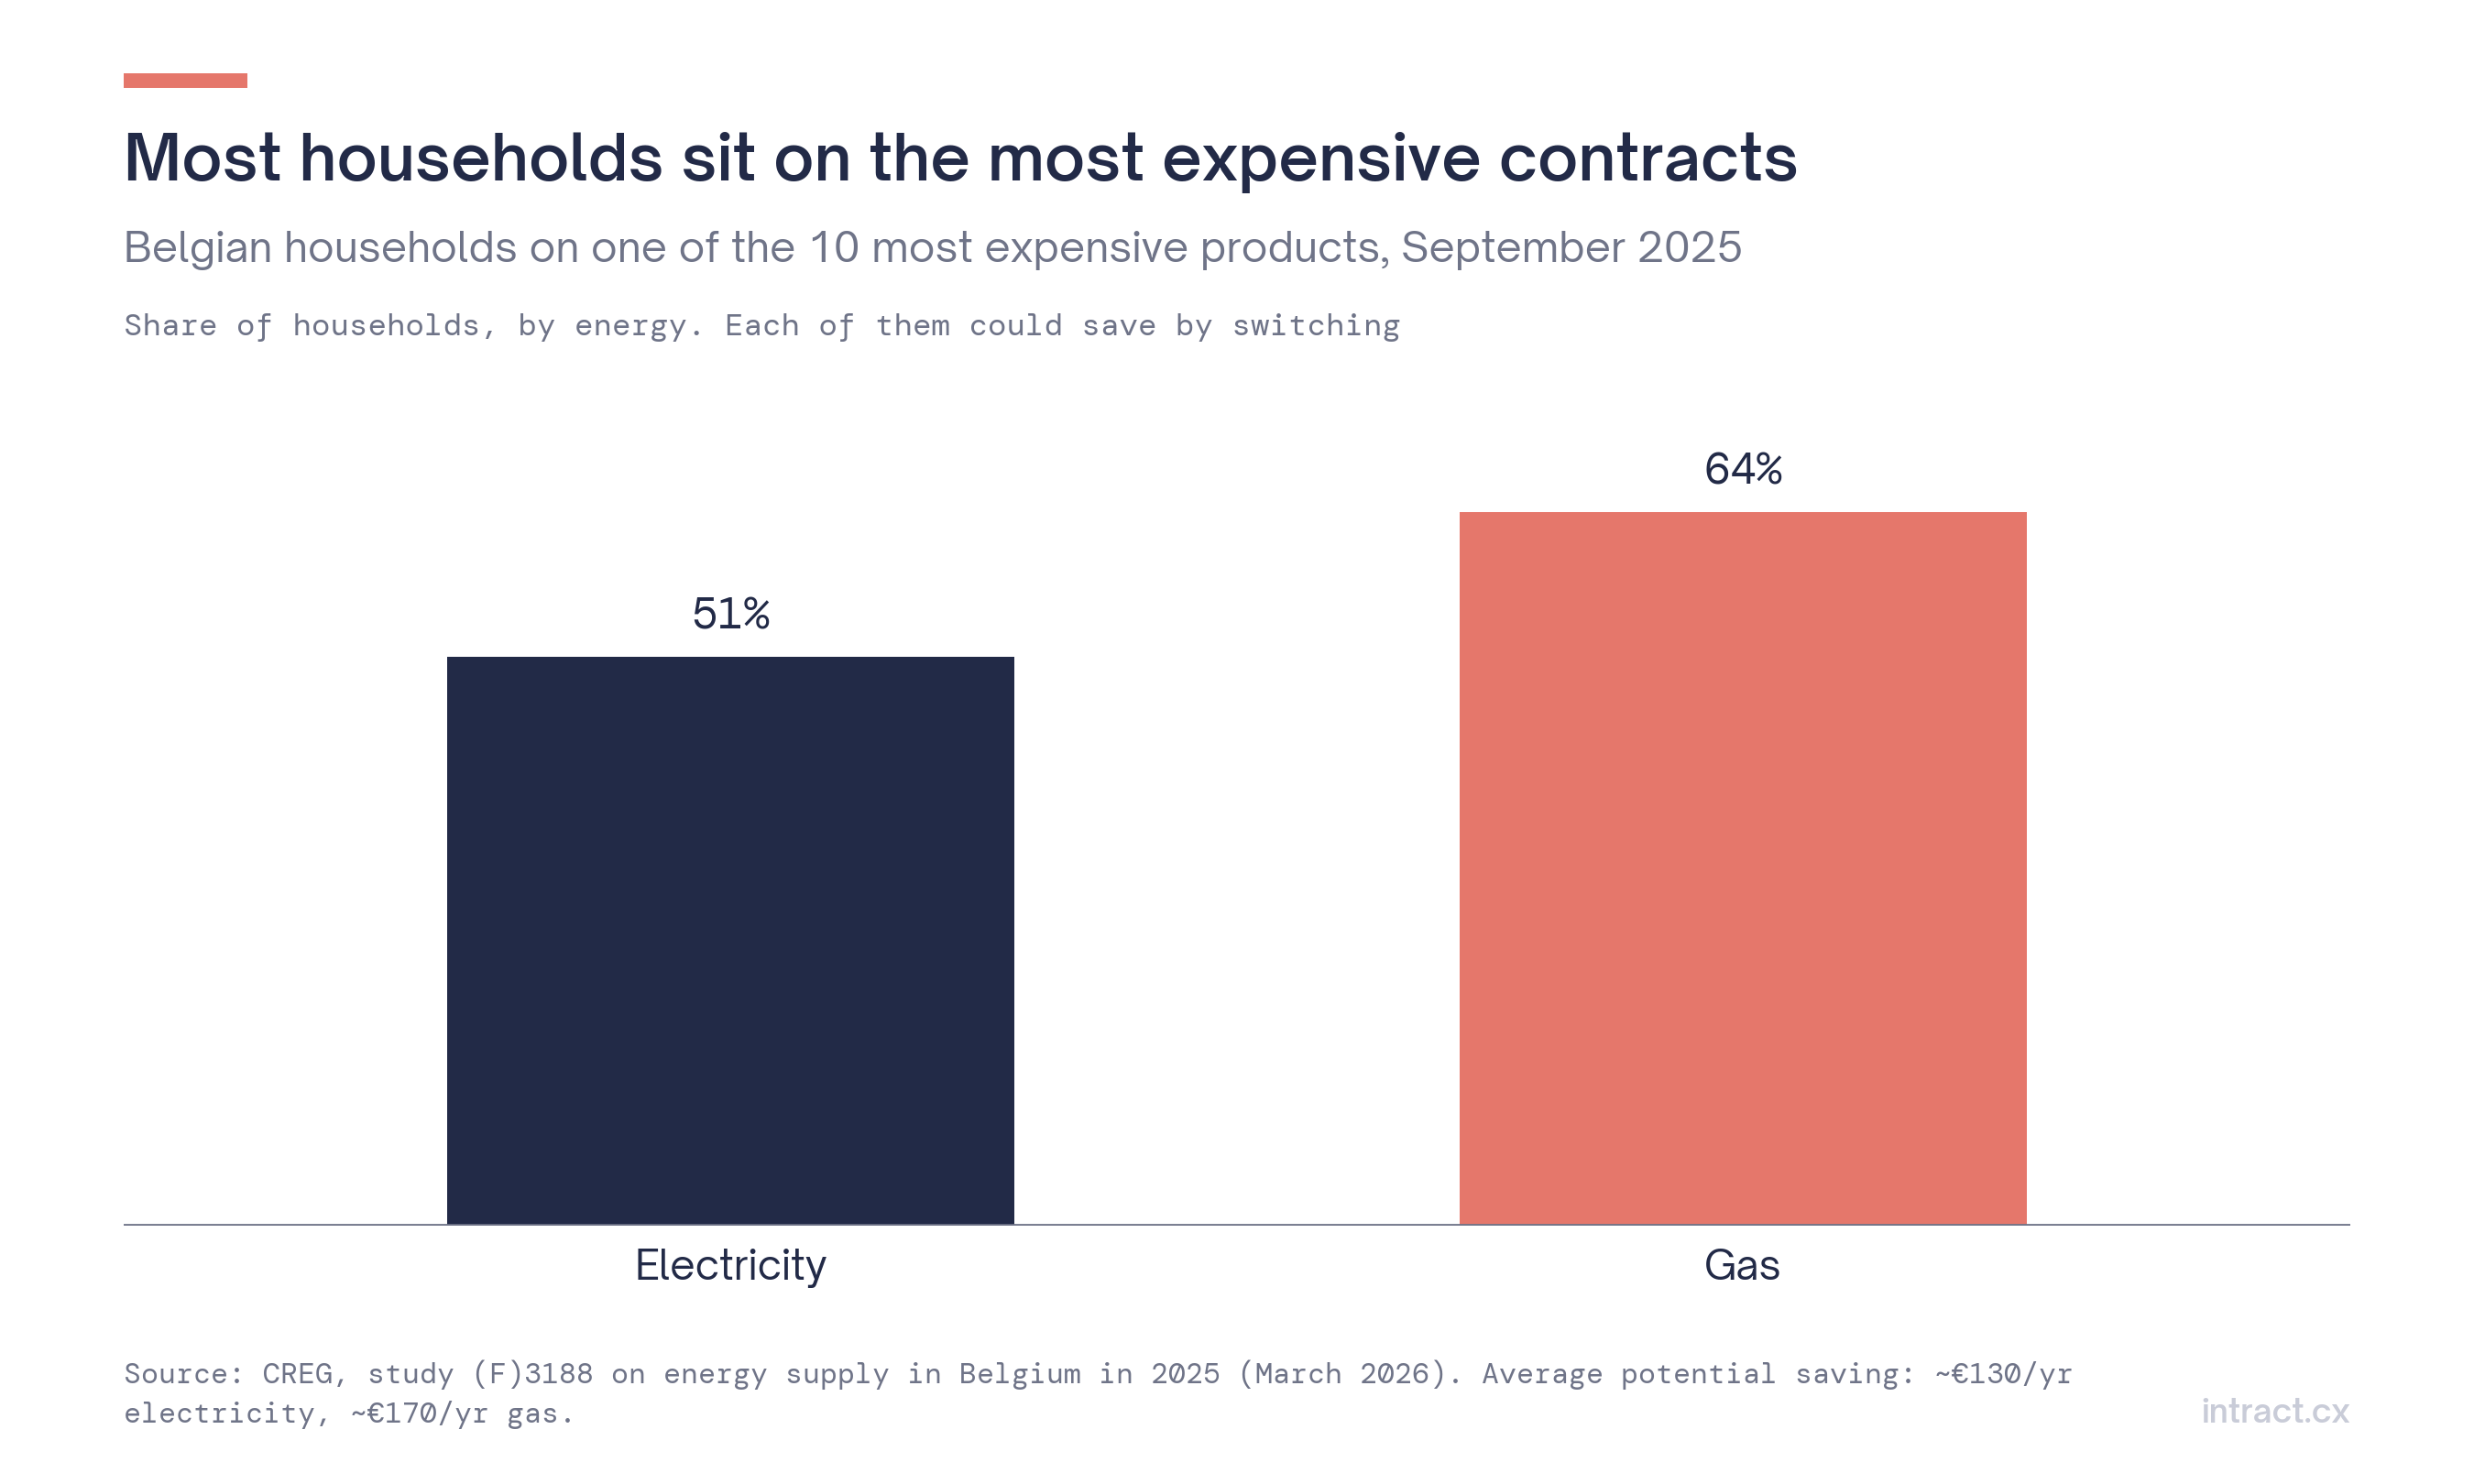 Figure 5. Belgian households on one of the 10 most expensive products, September 2025.
The market is concentrated: in Flanders, Engie, Luminus and Eneco hold about three-quarters of electricity supply points, with up to 22 active suppliers competing for the rest. For an incumbent, every point of churn is large in absolute terms.
6. What supplier calls can show before the ombudsman does
Every category in the ombudsman's list starts as a call. The difference is timing: the ombudsman's report arrives a year later, the call arrives today.
| Signal in the call | What to extract | Who acts |
|---|---|---|
| Disputed meter reading or estimated bill | Reason: meter / estimate / regularisation, amount contested | Billing operations |
| "This is the third time I call" | Repeat contact, unresolved issue | Service management |
| Payment plan request, hardship | Payment difficulty, vulnerability cues | Collections, social team |
| "I've seen a cheaper offer at…" | Churn intent, competitor named, price objection | Retention |
| Threat to go to the ombudsman | Complaint flag, urgency | Complaints team |
| Move, new connection, blocked supply point | Process friction, dependency on grid operator | Operations |
Three measures that can be built from calls:
- Reason mix by week, to spot a billing or metering spike within days.
- Churn signals by reason: which issues push customers towards competitors.
- Complaint candidates vs registered complaints, to estimate how many escalations could have been caught (see our article on spoken complaints).
How Intract supports this
Intract analyses every call it receives (natively from Aircall or Vonage, or any other source through its API). Each interaction gets a summary, business impact, sentiment, urgency and churn risk; complaints are surfaced on the customer profile, in filters, dashboards and Teams alerts. Your contact-reason tree (meter, billing, payment, move, contract, price) runs as a no-code classifier with categories and sub-categories, tested on your own calls before going live, and an AI step can capture which competitor was named. Dashboards track reasons, complaints and churn signals by week; a Microsoft Teams alert can warn a team on every call that matches your rule, for example a customer threatening to go to the ombudsman; and a weekly cited report explains what changed and why, each claim linked to the calls. Calls are transcribed in more than 40 languages, including French, Dutch and German, and data is hosted in the EU.
Customer volumes and contract details can be sent with each call as business metadata through the API.
FAQ
Do we have to change our wrap-up codes? No. Intract adds its own reason next to them, captured from the conversation.
Can it detect churn intent and competitor mentions? Yes: churn risk is flagged on every interaction, and competitor mentions can be extracted with a workflow you define and test.
Can it handle our call volume? Confirm volumes and set-up with the Intract team during the demo.
Methodology and sources
Energy Ombudsman figures come from its official press releases; 2020 is derived from the published +36.9% rise to 2021, and 2019 was not found. 2022 category shares are not shown because secondary sources disagree. Price indices are Intract calculations from Eurostat data (gas data missing for some half-years). Switching rates exclude contract changes with the same supplier; Wallonia is not shown for lack of a clean series. CREG data were read from a third-party copy of the report.
- Federal Energy Ombudsman, press releases on 2021, 2023, 2024 and 2025; VRT NWS, Klachten ombudsdienst energie; BX1, 2018
- Eurostat, nrg_pc_204, nrg_pc_202, ilc_mdes07
- ACER, Market Monitoring Report: retail and consumer protection 2023
- VREG, Actieve leveranciers en leverancierswissels 2025; Marktmonitor 2025; Marktaandelen; Dienstverlening, klachten en factuurcontrole
- Brugel, Rapport annuel 2024; CWaPE, Rapport OSP 2025
- CREG, Étude (F)3188, fourniture d'énergie en Belgique en 2025
- Médiateur national de l'énergie, Rapport annuel 2022; Connaissance des Énergies, Rapport 2025