
TL;DR
CX managers win budget by turning what they already know into evidence leadership cannot dismiss: a number counted on every conversation, traceable customer quotes, a trend and a cost. The gap is real: 42% of CX practitioners cite demonstrating ROI as a top barrier to CX investment, and in Germany 96% of CX professionals measure satisfaction but only 20% translate it into financial impact. Organisations linking satisfaction to growth and margin are 29% more likely to secure more CX budget (Gartner). This guide covers why CX arguments get dismissed, what actually wins budget, the number + quote + trend + cost method and an illustrative worked example.
A CX manager we work with put it plainly: her problem was never knowing what her customers were going through. It was getting her leadership to hear it. Her observations rested on calls she had listened to, tickets she had read and what her team told her. Solid, but easy to dismiss as anecdote.
She is not alone. The data shows that CX teams spend a large share of their time making the case for CX, and that most of them cannot connect what they measure to money. This article looks at why, and at a method to move from "I know" to "here is the proof".
Key figures
| Figure | Value | Source |
|---|---|---|
| CX practitioners citing "demonstrating ROI" as a top barrier to CX investment | 42% | CX Network, Global State of CX 2024 |
| CX practitioners saying CX delivers benefits that go unmeasured | 63% | CX Network, 2024 |
| Time US CX leaders spend making the case for CX | 40% | Deloitte Digital, via CX Dive (2025) |
| German CX teams measuring satisfaction / translating it into financial impact | 96% / 20% | Deloitte Digital CX Study 2025 |
| Organisations linking satisfaction to growth and margin: more likely to secure more CX budget | +29% | Gartner, 2022 |
| Change in service budgets vs AI spending, 2026 | +2% vs +38% | Gartner, 2026 |
| Consumers giving feedback after a very poor experience | 32% | Qualtrics XM Institute 2024 (vendor) |
1. The problem: CX knows, but cannot prove
CX Network's 2024 Global State of CX found that the top barriers to CX investment are demonstrating ROI (42%), finding budget (38%) and stakeholder buy-in (35%). 63% of respondents said CX delivers benefits that go unmeasured.
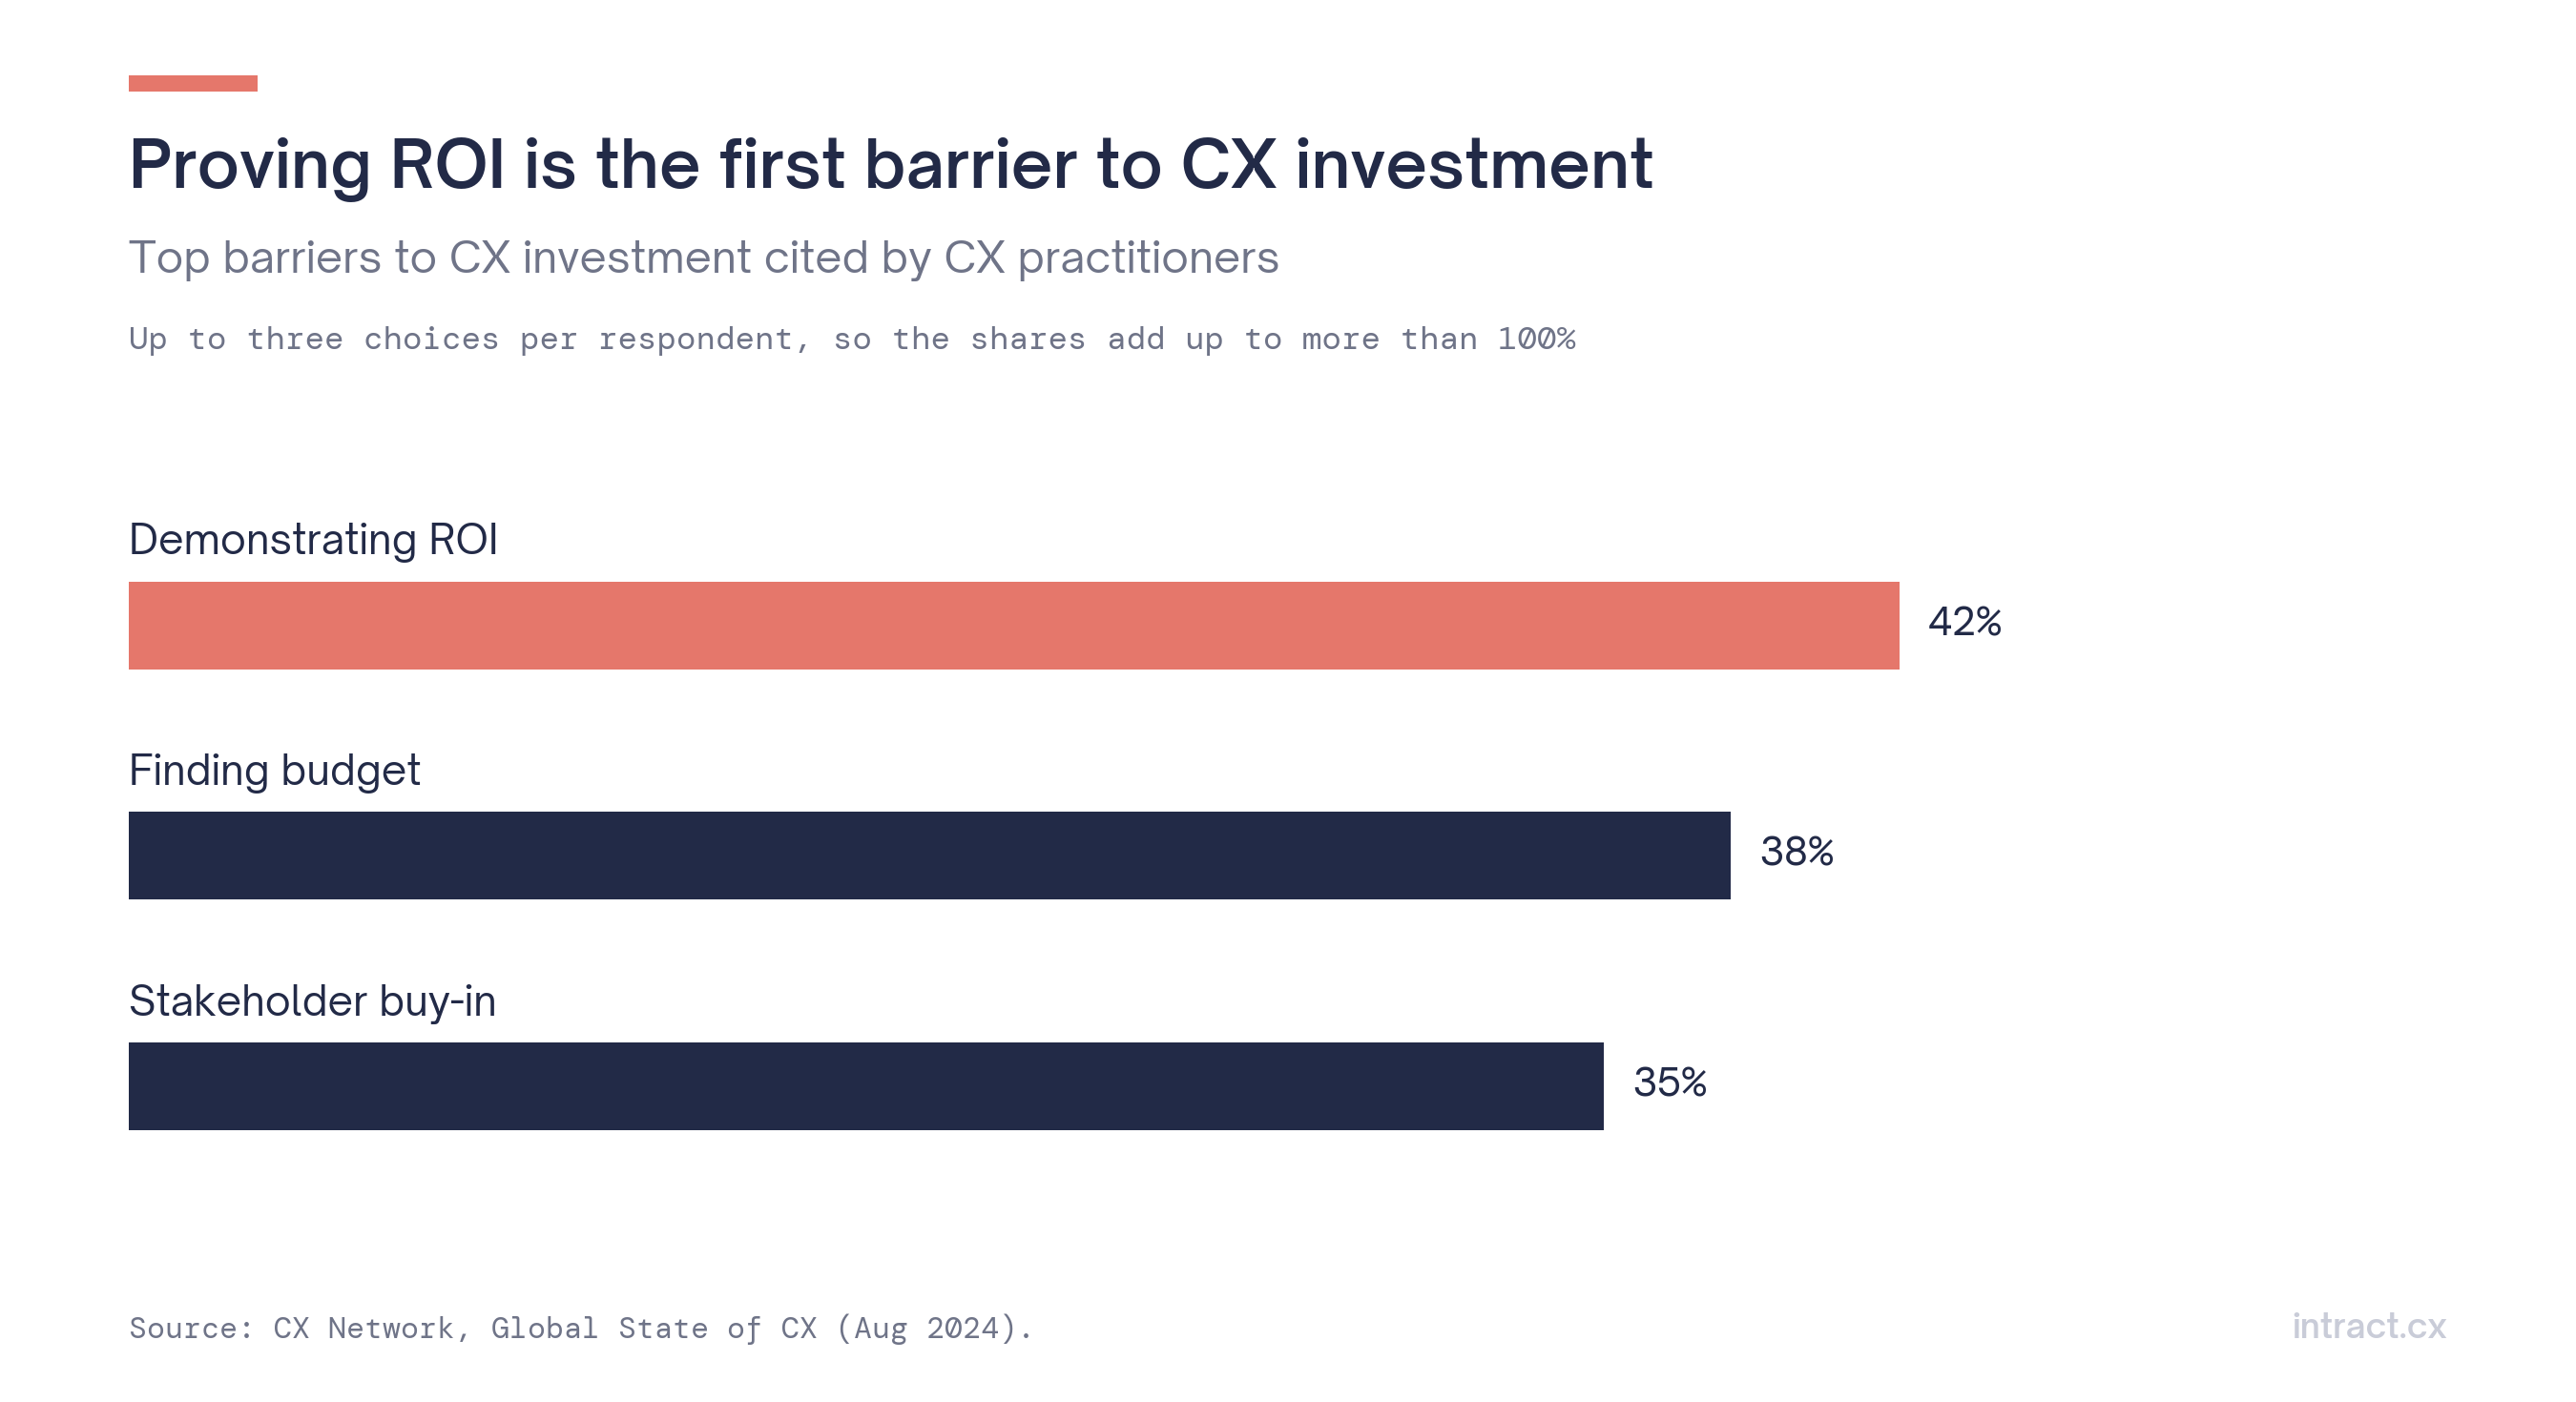 Figure 1. Proving ROI is the first barrier to CX investment.
In the US, Deloitte Digital found that CX leaders spend 40% of their time making the case for CX, and that "securing enough budget" jumped from the ninth to the second biggest challenge in 2024.
In Germany, Deloitte's 2025 CX study puts the gap starkly: 96% of CX professionals measure customer satisfaction, but only 20% translate it into financial impact.
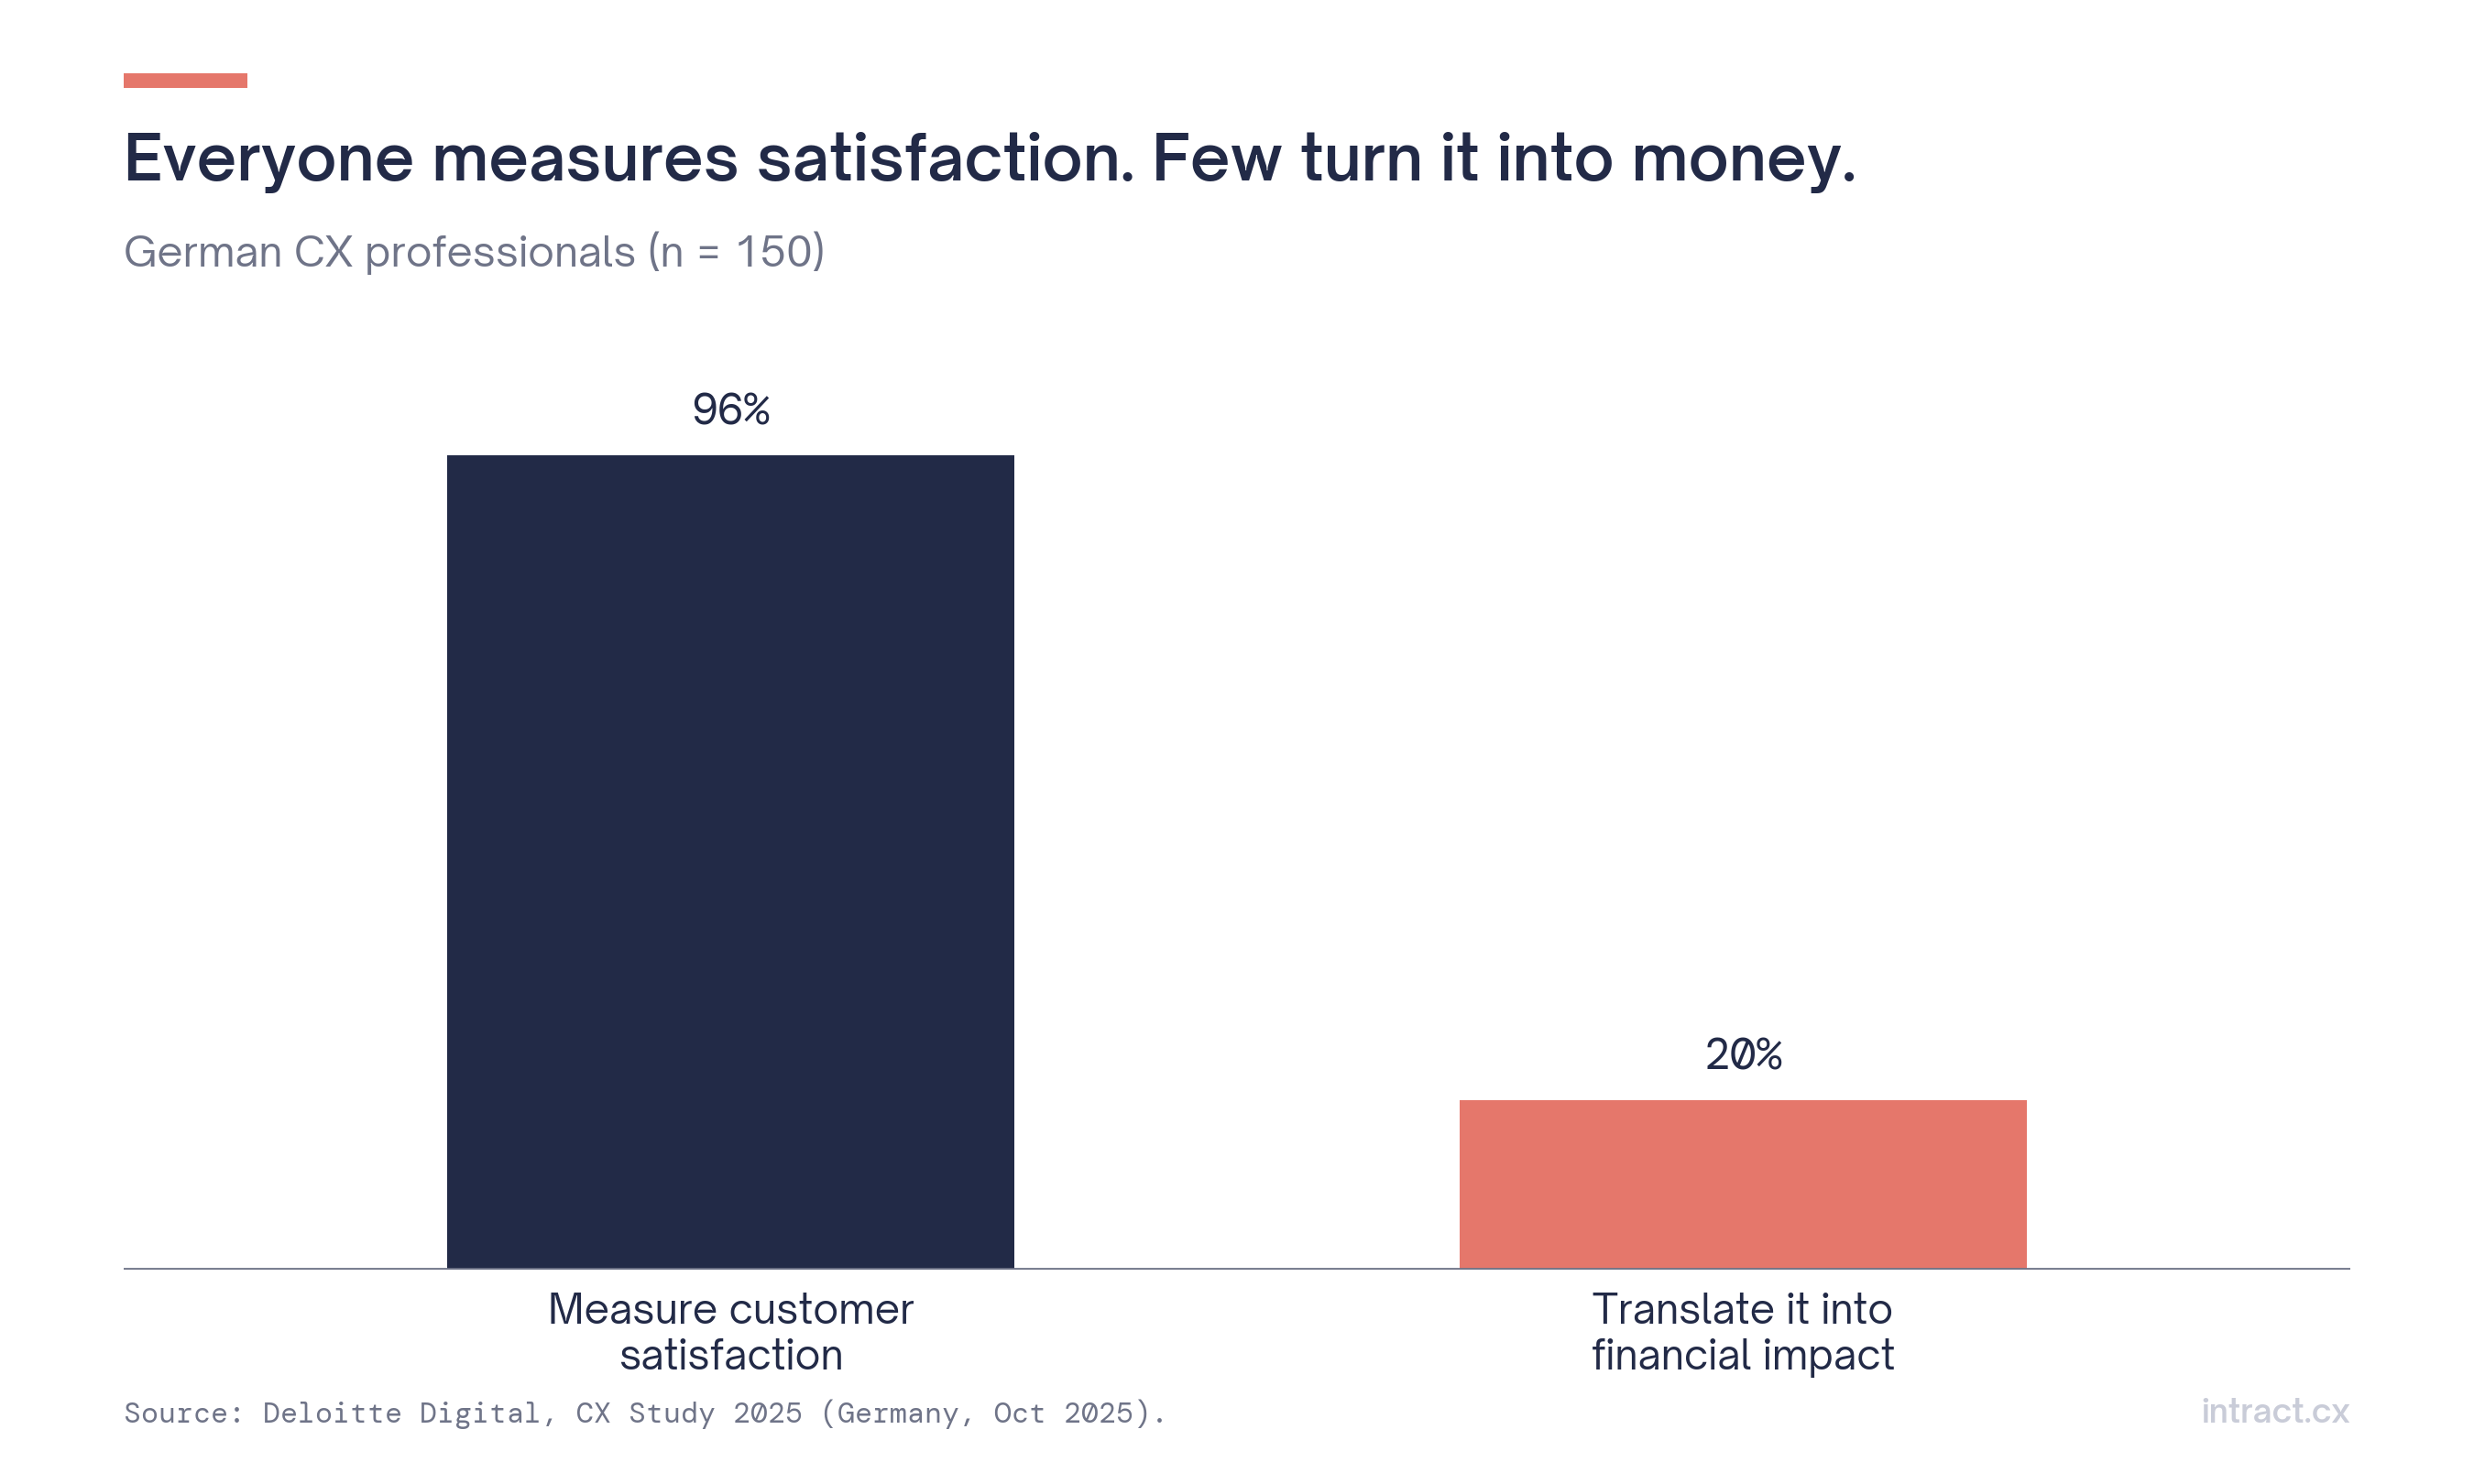 Figure 2. Everyone measures satisfaction; few connect it to money.
2. Why CX arguments get dismissed
Three reasons come up again and again.
The sample is small. Surveys reach fewer customers each year. Qualtrics XM Institute found that only 32% of consumers gave feedback to the company after a very poor experience in 2024, down 7.7 points since 2021; its 2025 study describes this as an all-time low. Manual QA reviews 2–5% of calls (see our article on QA sampling). Anything built on that base invites the question "how representative is this?"
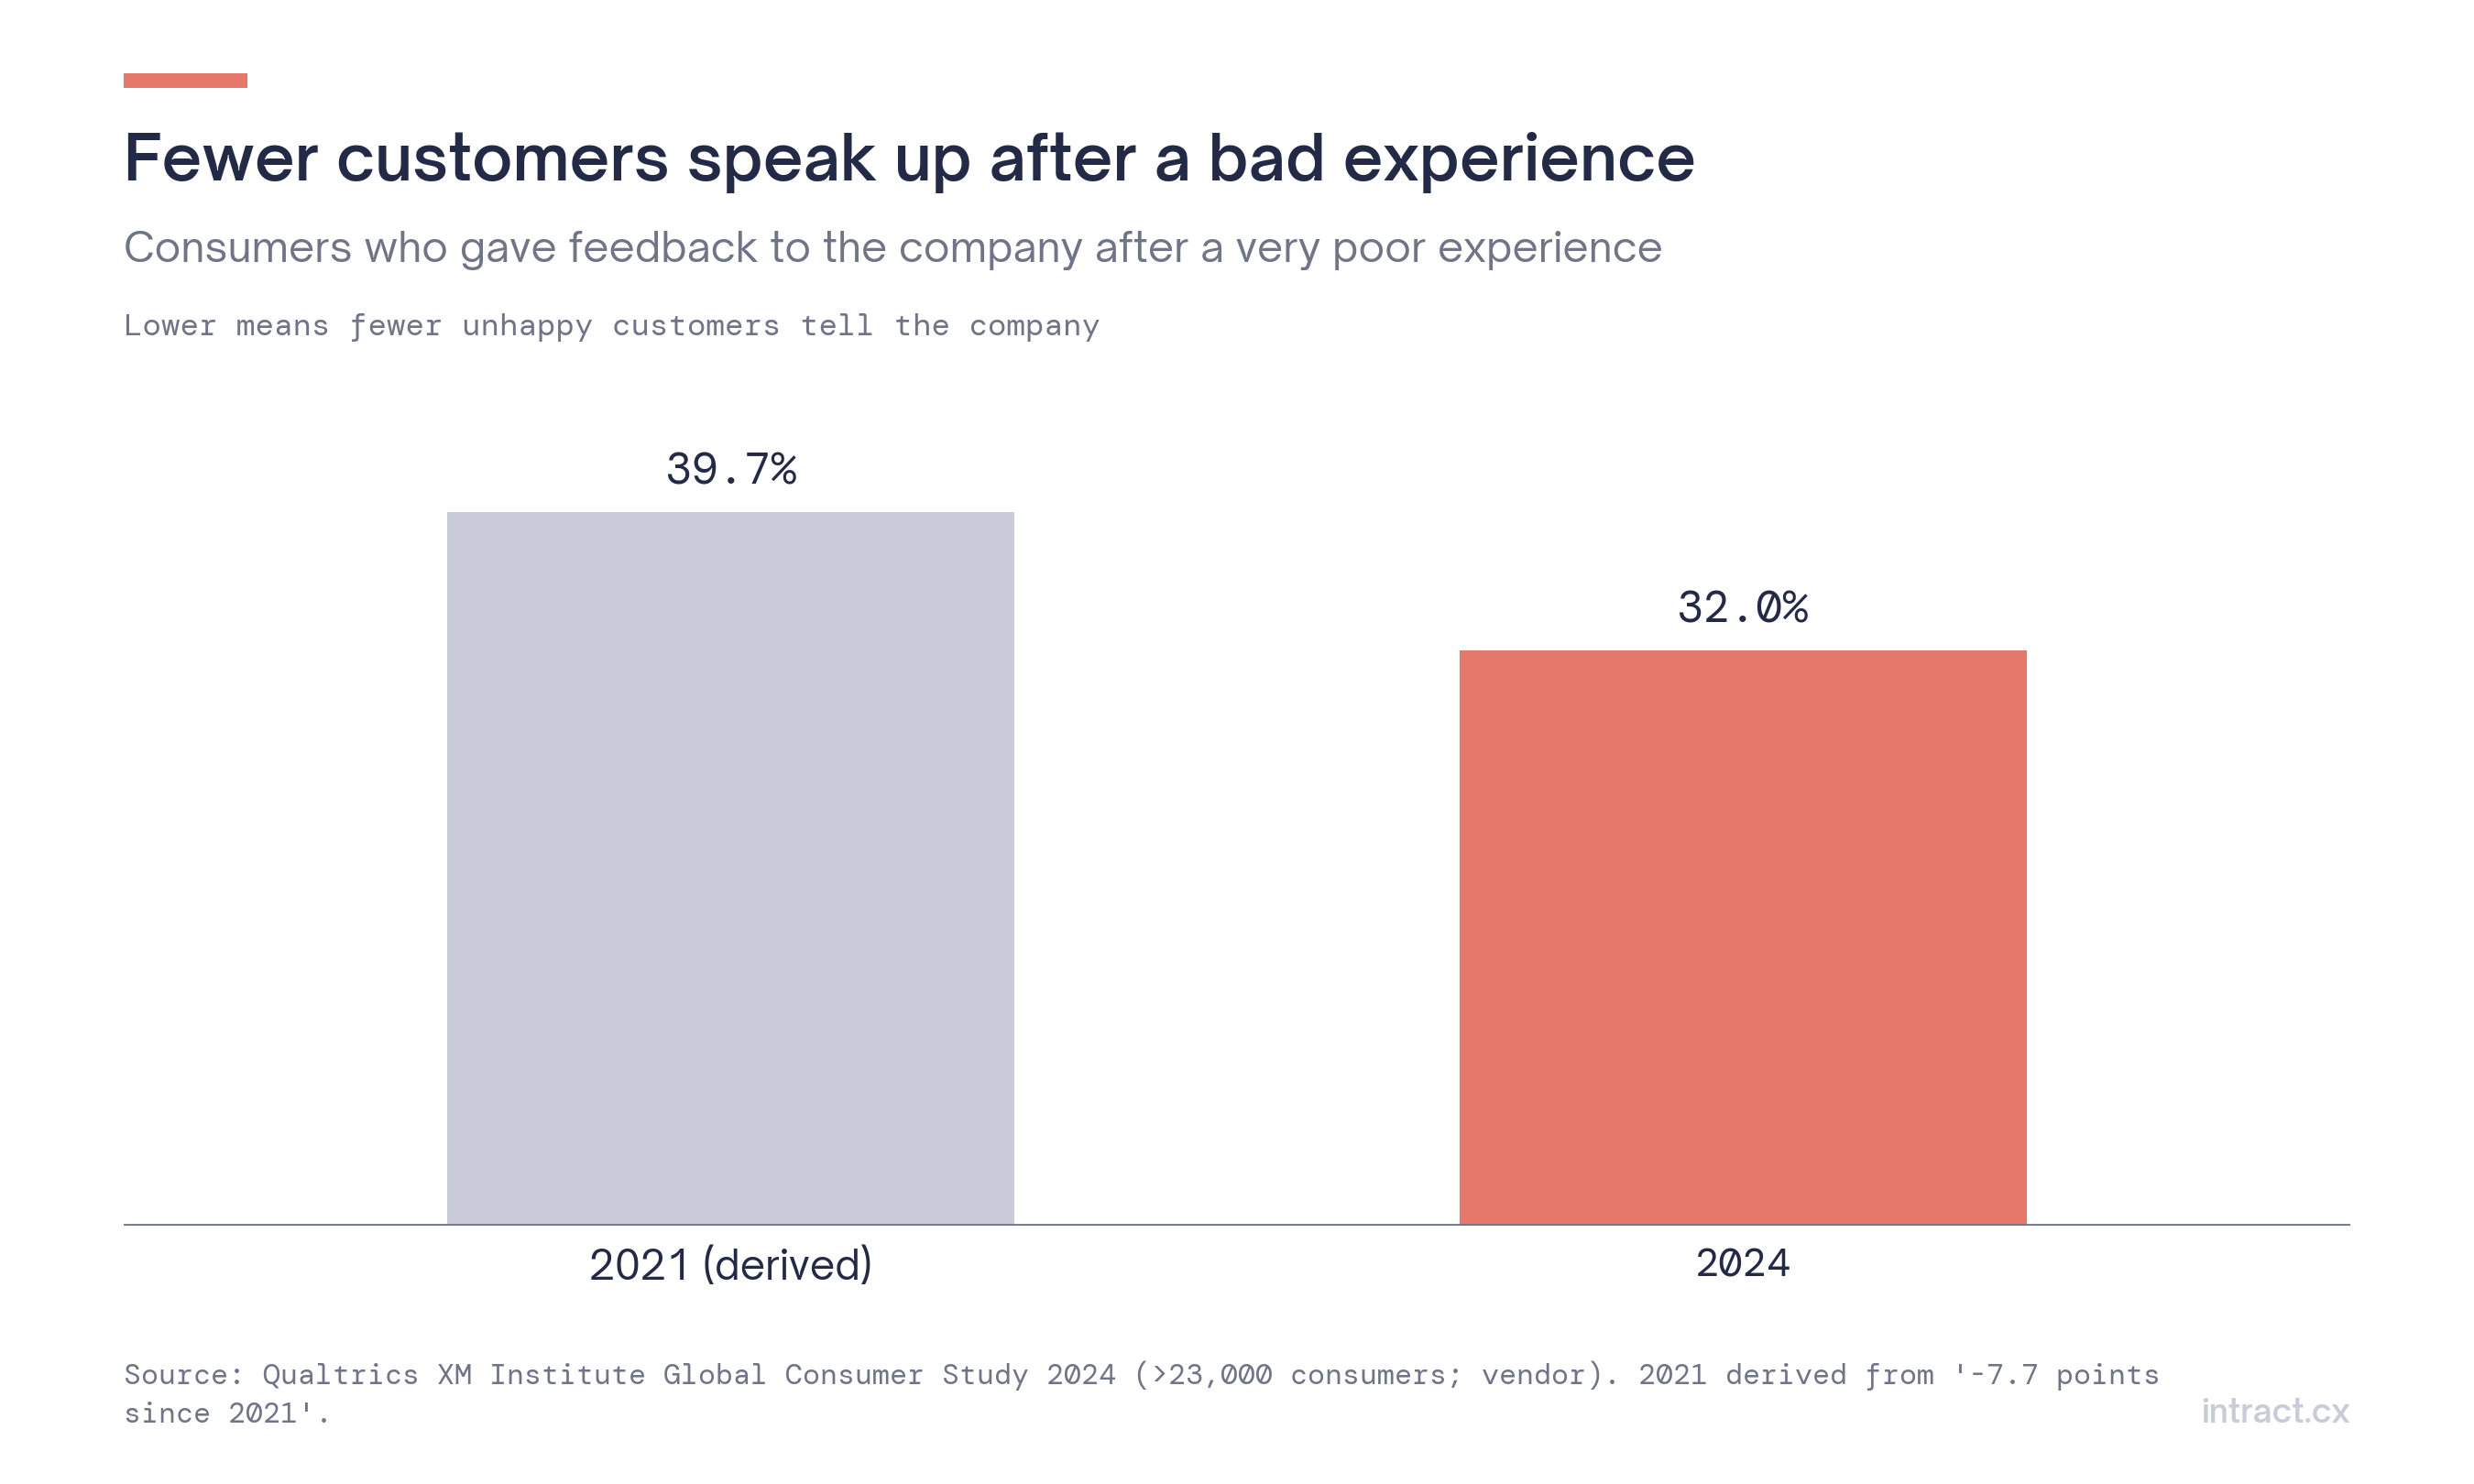 Figure 3. Fewer customers speak up after a bad experience.
The story has no number. "Customers are frustrated with the new billing process" is a story. Leadership asks "how many, how much, since when?"
The number has no story. "NPS dropped 4 points" is a number. Leadership asks "why?", and the answer is back to anecdotes.
A popular claim says people remember stories far better than statistics. It comes from a classroom exercise described in Made to Stick by Chip and Dan Heath, not a controlled study, so we won't lean on the percentages. The underlying point holds in most boardrooms: you need both the number and the customer's voice.
3. What actually wins budget
The evidence points to linking CX to business outcomes. Gartner found that organisations connecting customer satisfaction to growth, margin and profitability are 29% more likely to secure more CX budget.
The budget environment makes this more urgent, not less. In 2026, customer service leaders' AI spending rose 38% while overall service budgets rose 2%. Money is moving towards things that can show results.
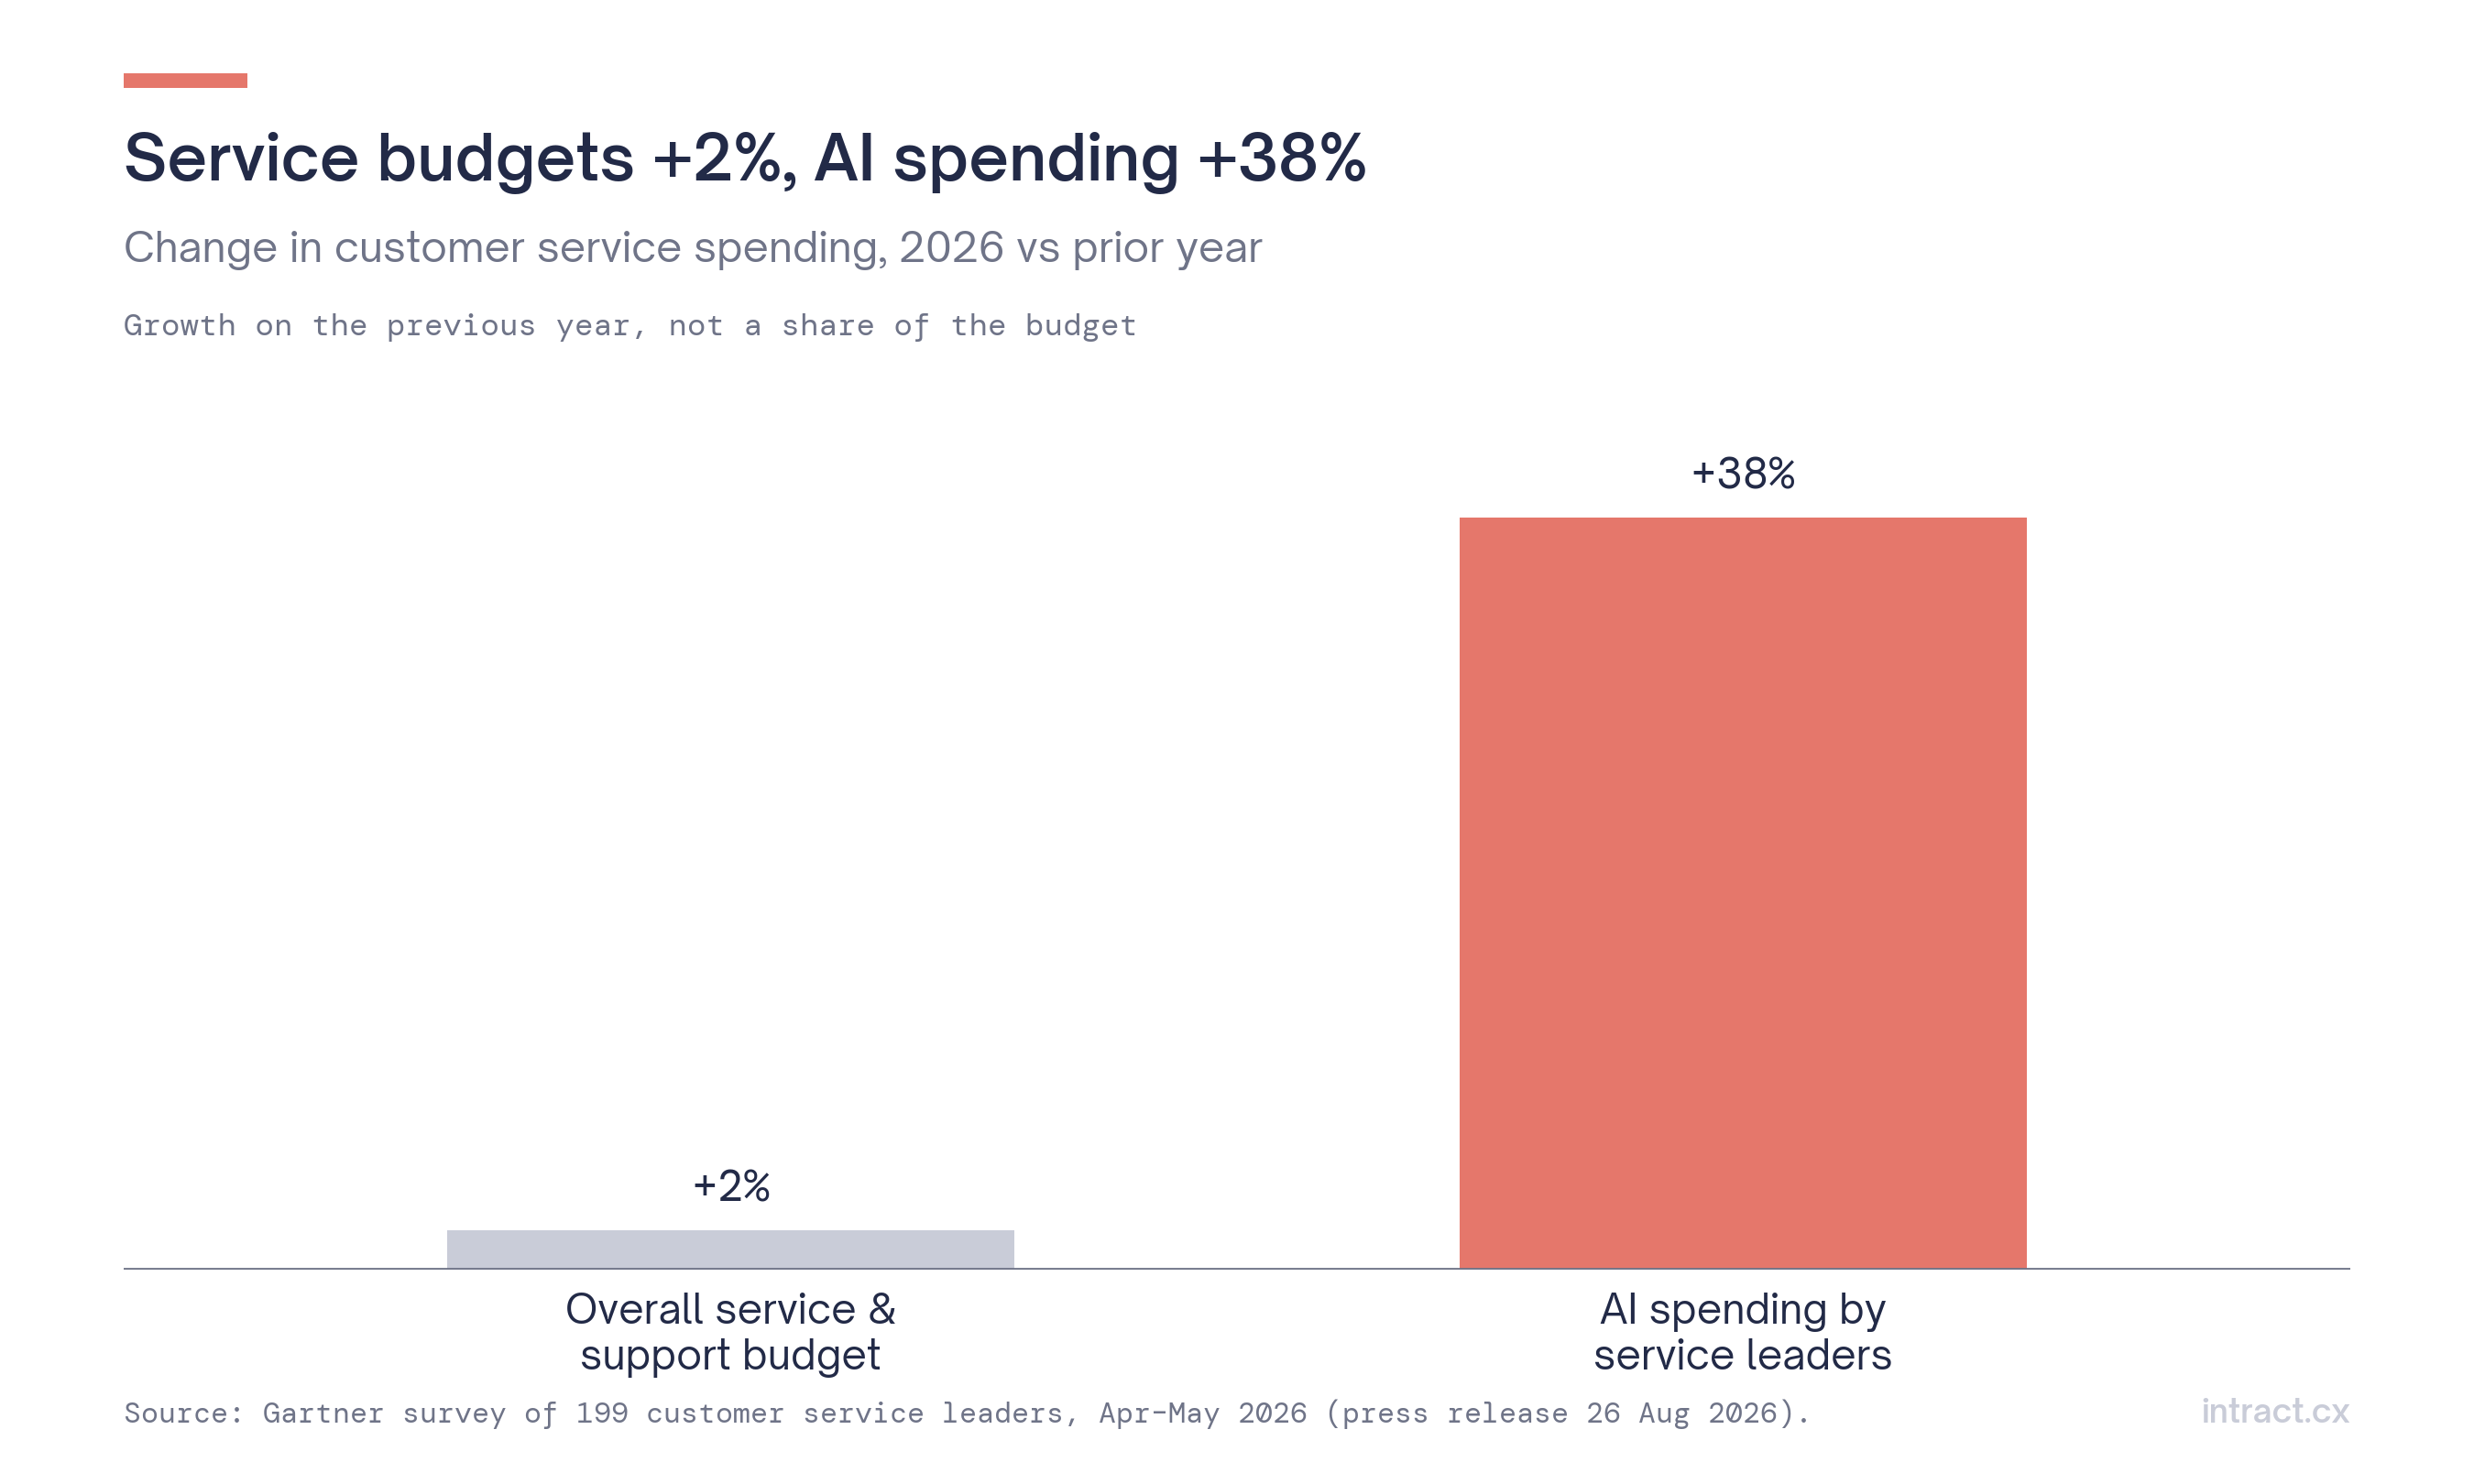 Figure 4. Service budgets +2%, AI spending +38% (Gartner, 2026).
The long-run business case for CX is well documented, with caveats. PwC's 2018 survey of 15,000 consumers found that 32% would leave a brand they love after one bad experience. Watermark Consulting's analysis of US listed companies found that CX leaders outperformed the S&P 500 by 45 points over 2007–2017, while laggards trailed it by 76 points (correlation, not causation). Useful context, but a CFO will want evidence from your customers.
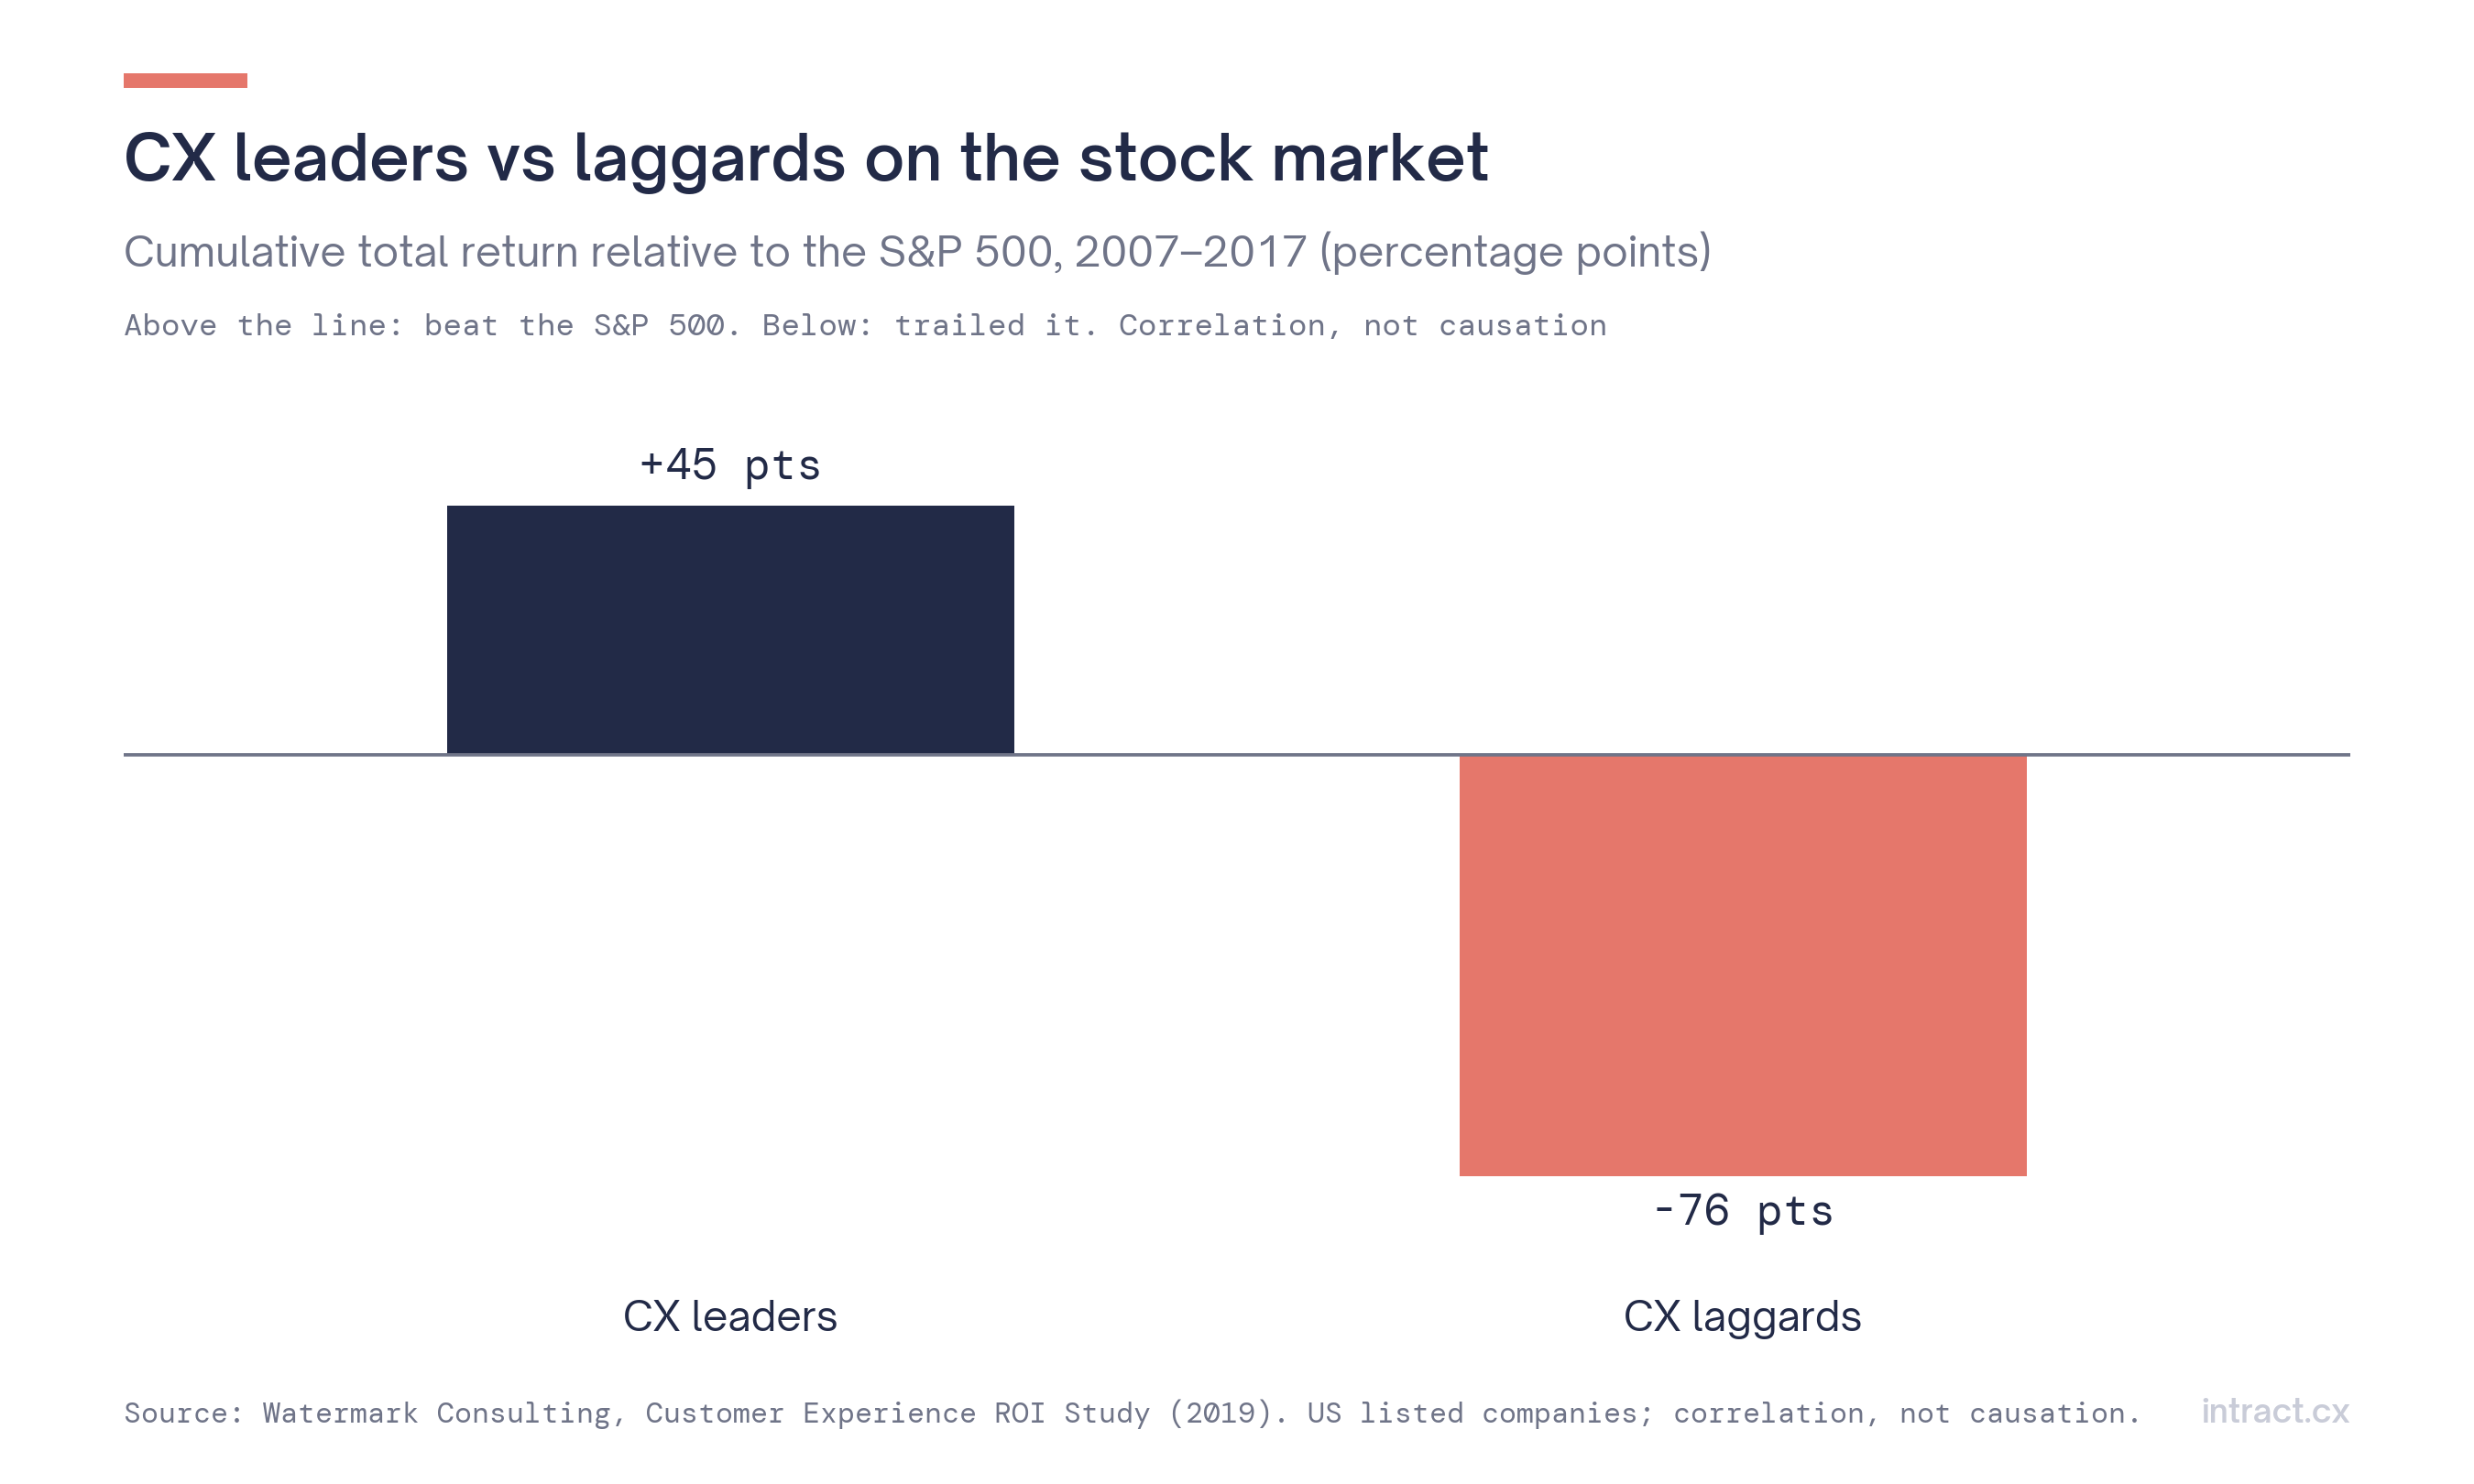 Figure 5. CX leaders vs laggards, relative to the S&P 500 (Watermark Consulting).
4. The method: number + quote + trend + cost
An argument that survives a sceptical committee has four parts.
| Part | Question it answers | Example |
|---|---|---|
| The number | How big is it? | "18% of calls in September mentioned the new billing format" |
| The quote | Is it real? | Three customer quotes, each linked to the original call |
| The trend | Is it getting worse? | "Up from 6% in June, before the change" |
| The cost | Why should we act? | "Calls about billing last 2 minutes longer; 1 in 5 carries a churn signal" |
Four rules make it credible:
- Count everything, not a sample. A rate computed on every conversation cannot be dismissed as unrepresentative.
- Make every claim traceable. Each figure should click through to the conversations behind it. Scepticism ends when someone can listen for themselves.
- Use your own categories. Measure the issue the way your business talks about it, not a generic topic list.
- Start the clock now. You cannot prove a trend you did not measure. Set up the measurement before the meeting where you will need it.
5. A worked example (illustrative)
A CX manager suspects that a new identity-verification step is driving complaints.
- Before: "Several agents say customers hate the new verification." The answer: "Let's wait for the next survey."
- After: "Since the change on 3 March, 14% of calls mention verification, against 2% before. 38% of those carry a complaint signal. Here are five customer quotes, each linked to the call. Calls mentioning verification last on average 90 seconds longer."
The second version is not more convincing because it is louder. It is more convincing because nobody can call it an impression. (Figures in this example are illustrative, not customer data.)
How Intract supports this
Intract analyses every call it receives (natively from Aircall or Vonage, or through its API for any audio or text conversation), so rates are computed on all interactions, not a sample. Each interaction gets a summary, business impact, sentiment, urgency and churn risk. Your own categories run as no-code workflows, and dashboards show how they evolve over time. Cited reports group recurring issues by theme, with an executive summary, and every claim links back to the calls behind it; you can search the transcript and replay the exact passage. Atlas, the built-in assistant, answers questions in plain language and turns the answer into a PowerPoint, Excel, Word or PDF document for the committee.
FAQ
Which figure convinces leadership most? One linked to a business outcome they already track: churn, cost to serve, complaints to the ombudsman, conversion.
How many quotes should I show? Three to five, chosen to represent the pattern, each traceable to its source. More reads as cherry-picking.
Can I prove something that happened last year? Only if it was measured. Start measuring now for the decisions you will need to argue next quarter.
Methodology and sources
Survey samples differ (global CX practitioners, US CX leaders, German CX professionals, global consumers) and are shown separately. The 2021 Qualtrics figure is derived from the reported 7.7-point decline. The worked example uses illustrative figures.
- CX Network, Prove CX delivers results (Aug 2024)
- CX Dive, Securing budgets: challenges for CX leaders (Feb 2025, Deloitte Digital data)
- Deloitte Digital, CX Study 2025 (Germany)
- Gartner, Most CX programmes are not delivering (May 2022); AI spending by customer service leaders (Aug 2026)
- Qualtrics XM Institute, Global consumers share feedback; Businesses risk $3 trillion (Nov 2025)
- PwC, Experience is everything (2018)
- Watermark Consulting, Customer Experience ROI Study (2019)