
TL;DR
Review enough calls to answer the question you are asking. Four calls per agent per month is enough to coach a conversation, not to say whether an agent is compliant: with 4 scored calls, an observed 80% is compatible with anything from 34% to 97% (95% Wilson interval). Four calls also usually miss rare problems, catching one that occurs in 1 call out of 20 only 18.5% of the time. Traditional QA reviews 2–5% of interactions (Gartner). Below, we put numbers on this with plain statistics you can rerun yourself: what sampling does well, what 100% analysis changes, and how to score everything and review the right calls.
Key figures
| Figure | Value | Source |
|---|---|---|
| Share of assisted interactions reviewed by traditional QA | 2–5% | Gartner |
| Contact centres evaluating 5+ calls per agent per month | 60% | SQM Group |
| Agents saying most of their conversations are never reviewed | 81% | Solidroad State of CX 2026 (vendor survey, n = 500) |
| Chance that 4 reviewed calls contain at least one problem call, if 5% of calls have a problem | 18.5% | Intract calculation |
| Width of the 95% confidence interval for an agent scored 80% on 4 calls | 34% to 97% | Intract calculation (Wilson interval) |
| Calls needed for a ±5-point margin on a centre-wide rate | ~385 | Intract calculation |
1. What the industry actually reviews
The numbers are consistent across sources, even if they disagree on the details.
- Gartner describes traditional QA as covering typically 2% to 5% of assisted service volume.
- SQM Group reports that 60% of contact centres evaluate five or more calls per agent per month. Call Centre Helper puts the most common range at 3 to 5 evaluations per agent per month, and notes there are no industry guidelines on ratios.
- COPC's 2022 benchmark of more than 900 executives found that 58% monitor agents weekly and 63% pick the transactions to review at random.
- On the agent side, a 2026 vendor survey of 500 support agents found that 81% say most of their conversations are never reviewed, and 37% say only 0–10% are.
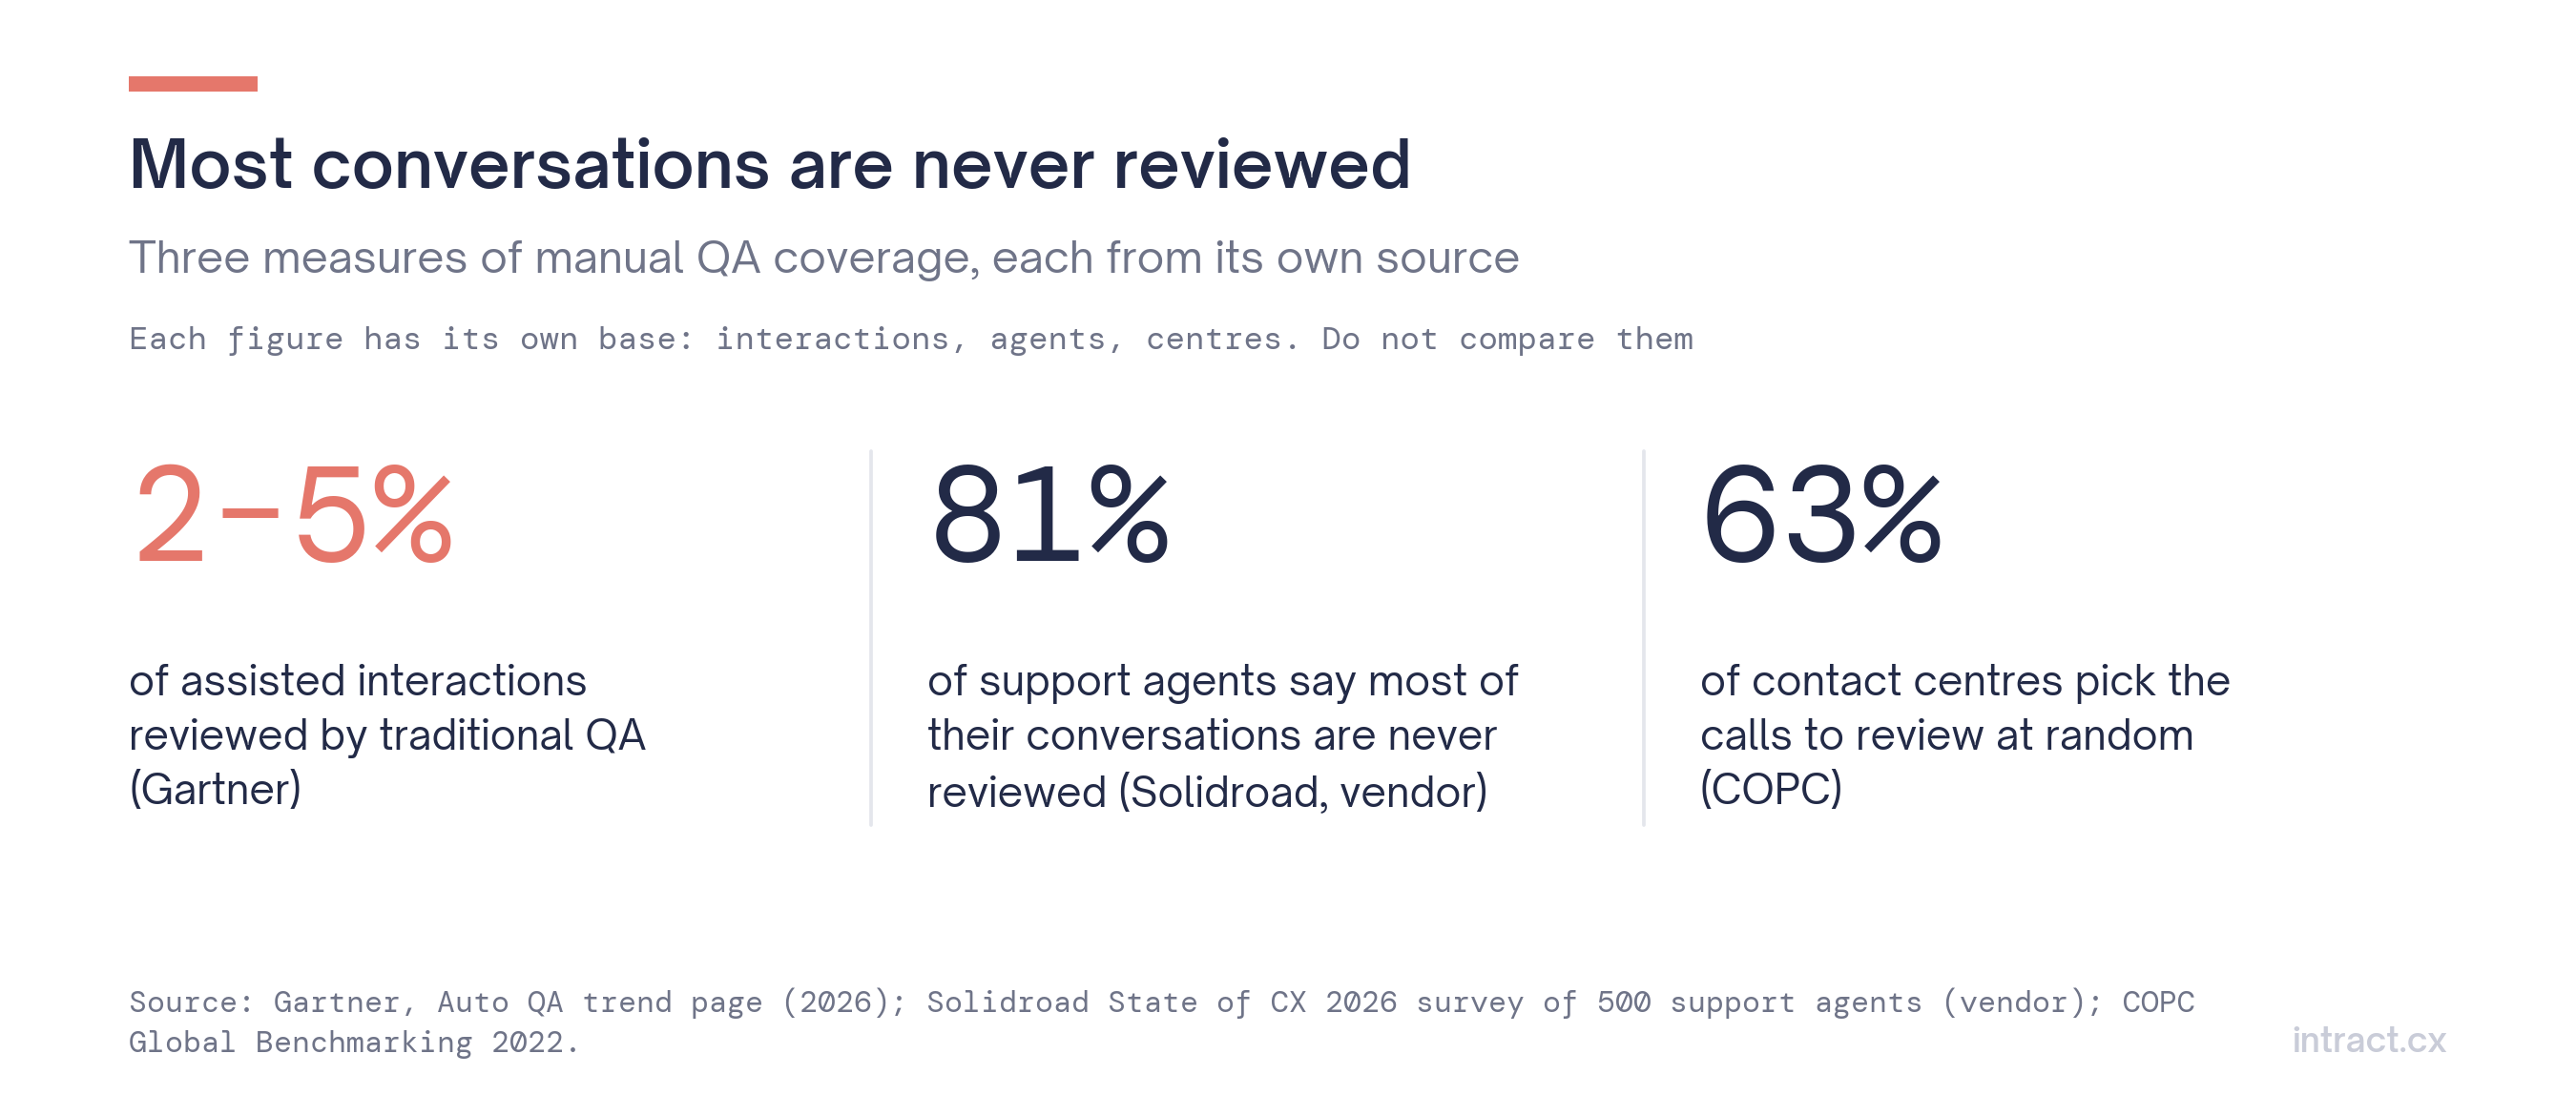 Figure 1. Coverage of manual QA, as reported by Gartner, Solidroad and COPC.
A widely repeated "1–2% of calls" figure also circulates. We could not trace it to a named study, so we use Gartner's 2–5% range.
2. The question sampling cannot answer: "Is this agent compliant?"
Imagine an agent scores 80% on a compliance grid across the calls you reviewed this month. How confident can you be that their true rate is close to 80%?
We computed the 95% confidence interval (Wilson method) for an observed 80% at different sample sizes.
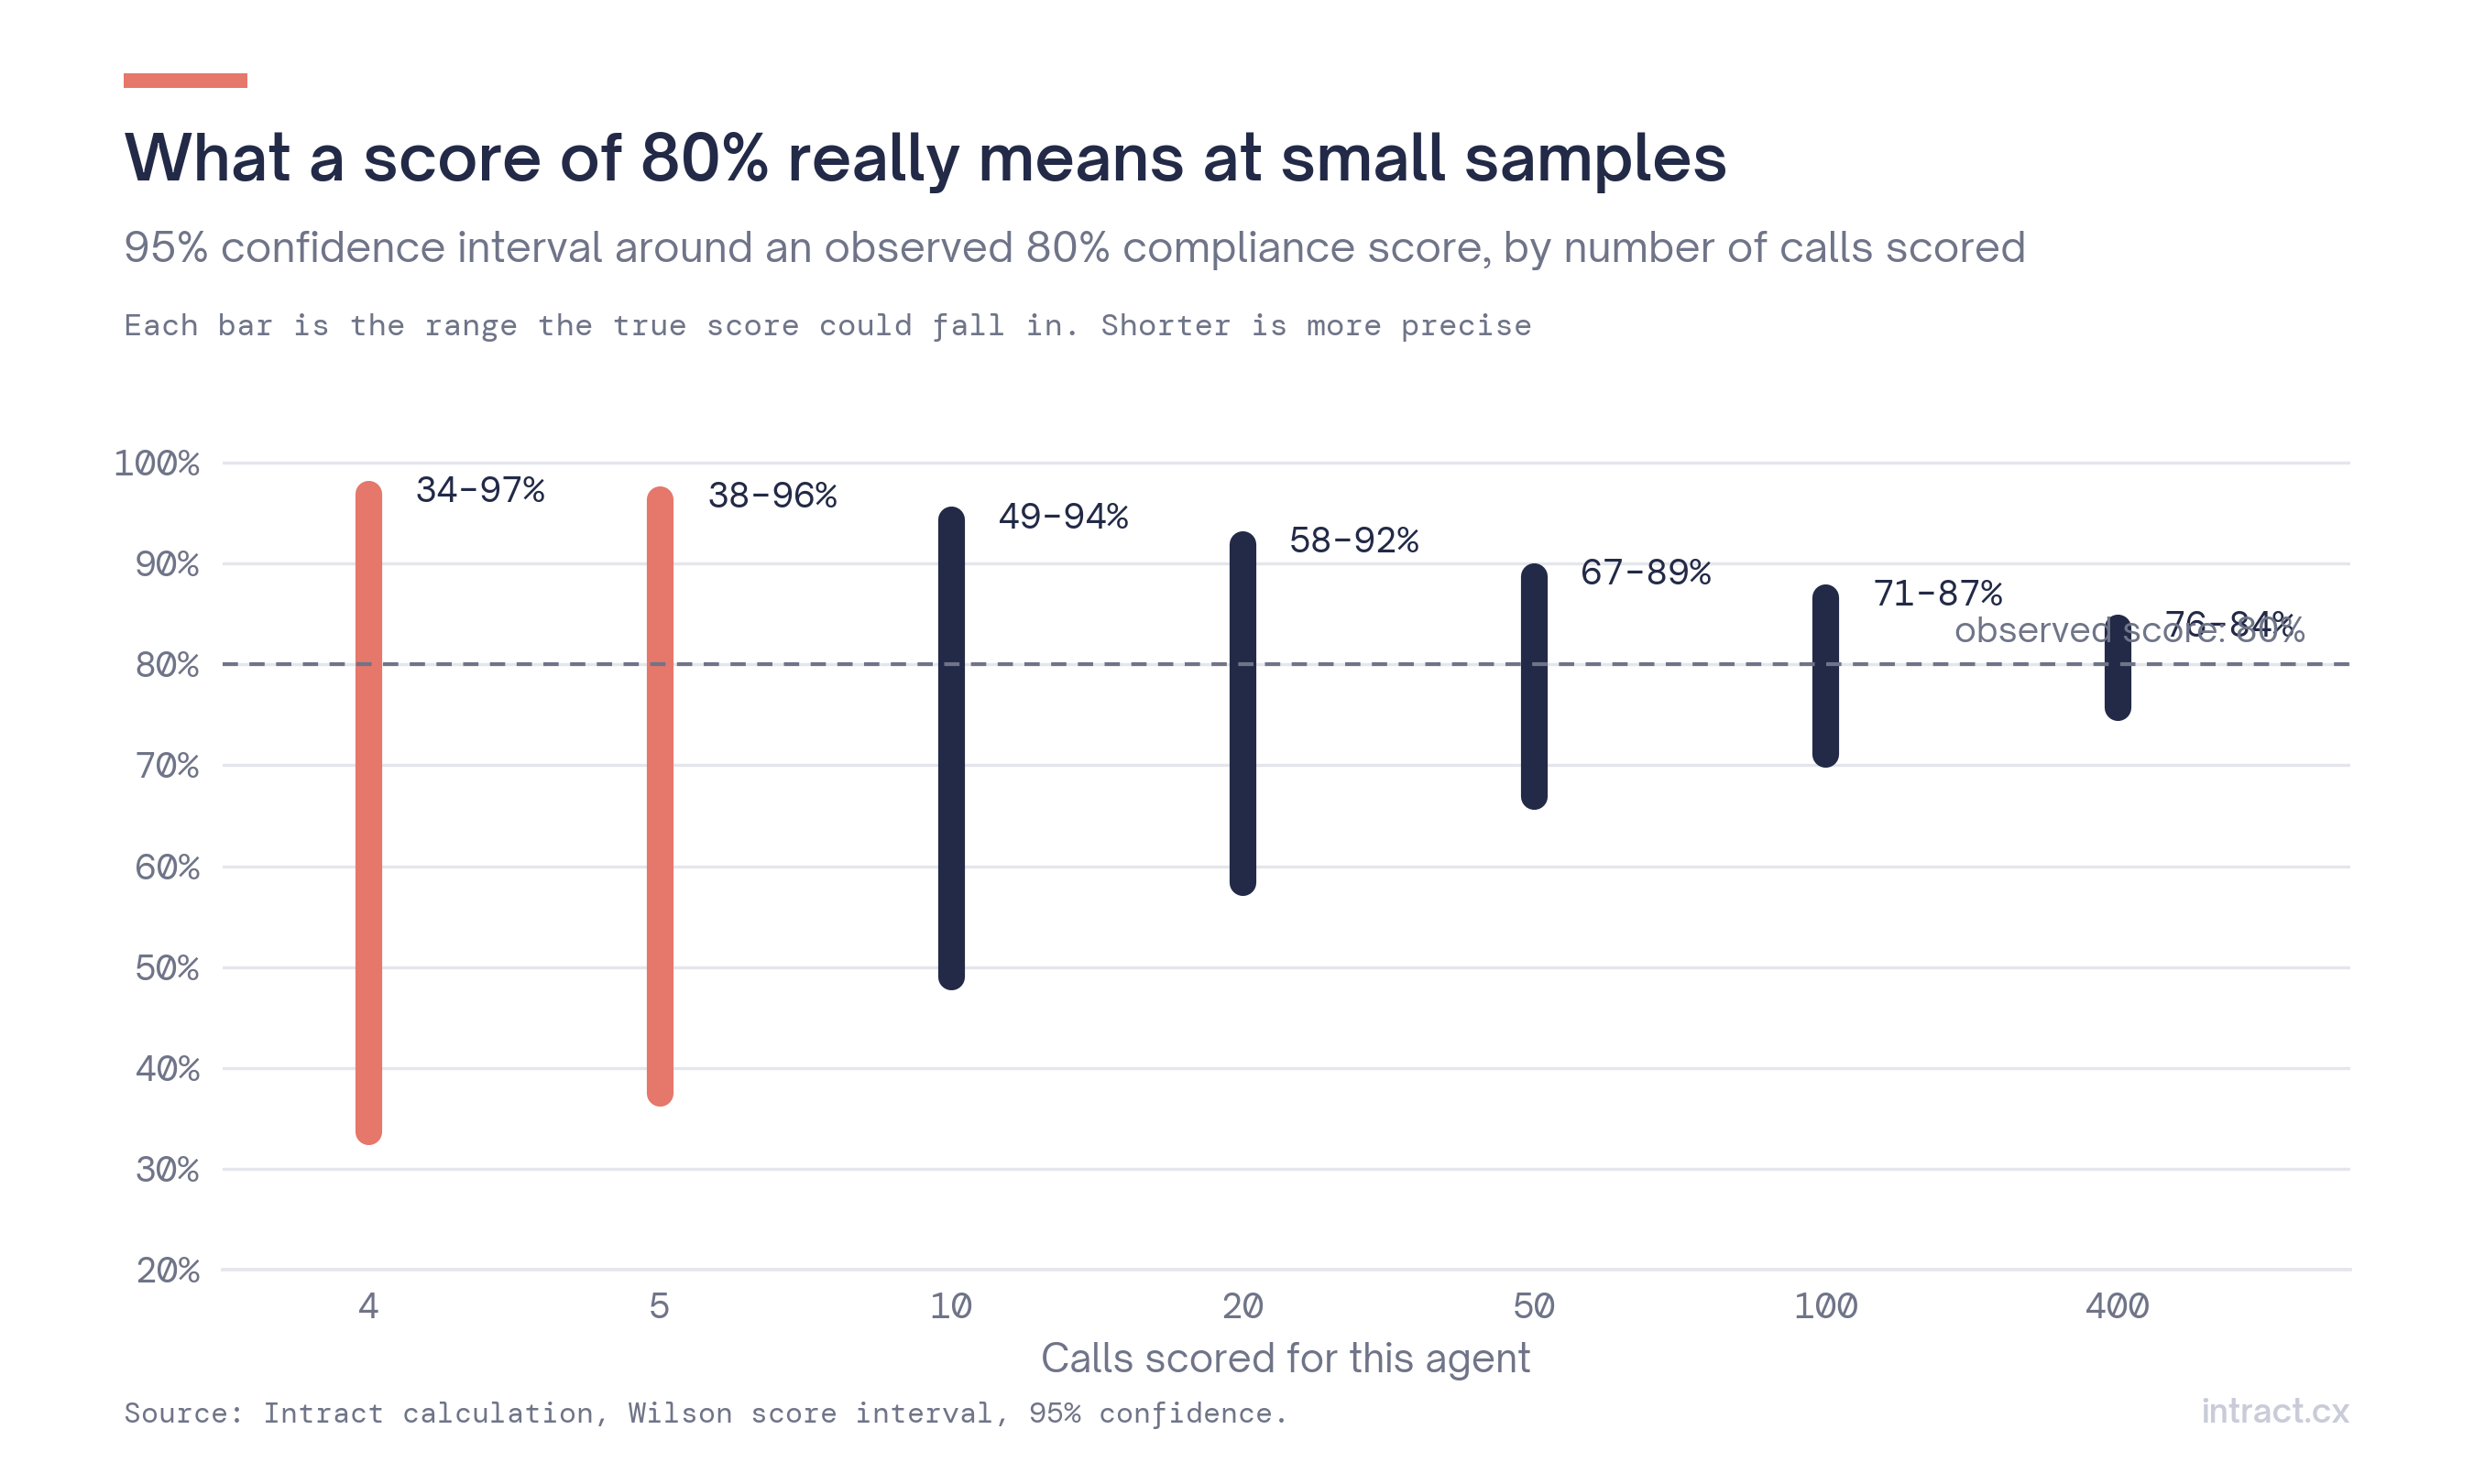 Figure 2. With 4 scored calls, an observed 80% is compatible with anything from 34% to 97%.
| Calls scored | 95% interval around an observed 80% |
|---|---|
| 4 | 34% – 97% |
| 5 | 38% – 96% |
| 10 | 49% – 94% |
| 20 | 58% – 92% |
| 50 | 67% – 89% |
| 100 | 71% – 87% |
| 400 | 76% – 84% |
At the sample sizes most teams use (3 to 5 calls), the interval spans more than 50 points. That is wide enough to put the same agent in "needs improvement" or "excellent" depending on which calls were drawn. This is not a criticism of reviewers. It is arithmetic.
It also explains part of the scoring disagreement QA teams see. ICMI guidance notes that teams starting calibration should expect a 20–30% variance between evaluators, improving to around 5% with practice. Sampling noise and evaluator noise stack on top of each other.
3. The question sampling answers badly: "Are we missing rare problems?"
Many of the issues that matter most are rare: a missed mandatory disclosure, a customer threatening to go to the ombudsman, a mis-sold product. If a problem appears in a fraction of an agent's calls and you review calls at random, the chance of seeing it at least once is .
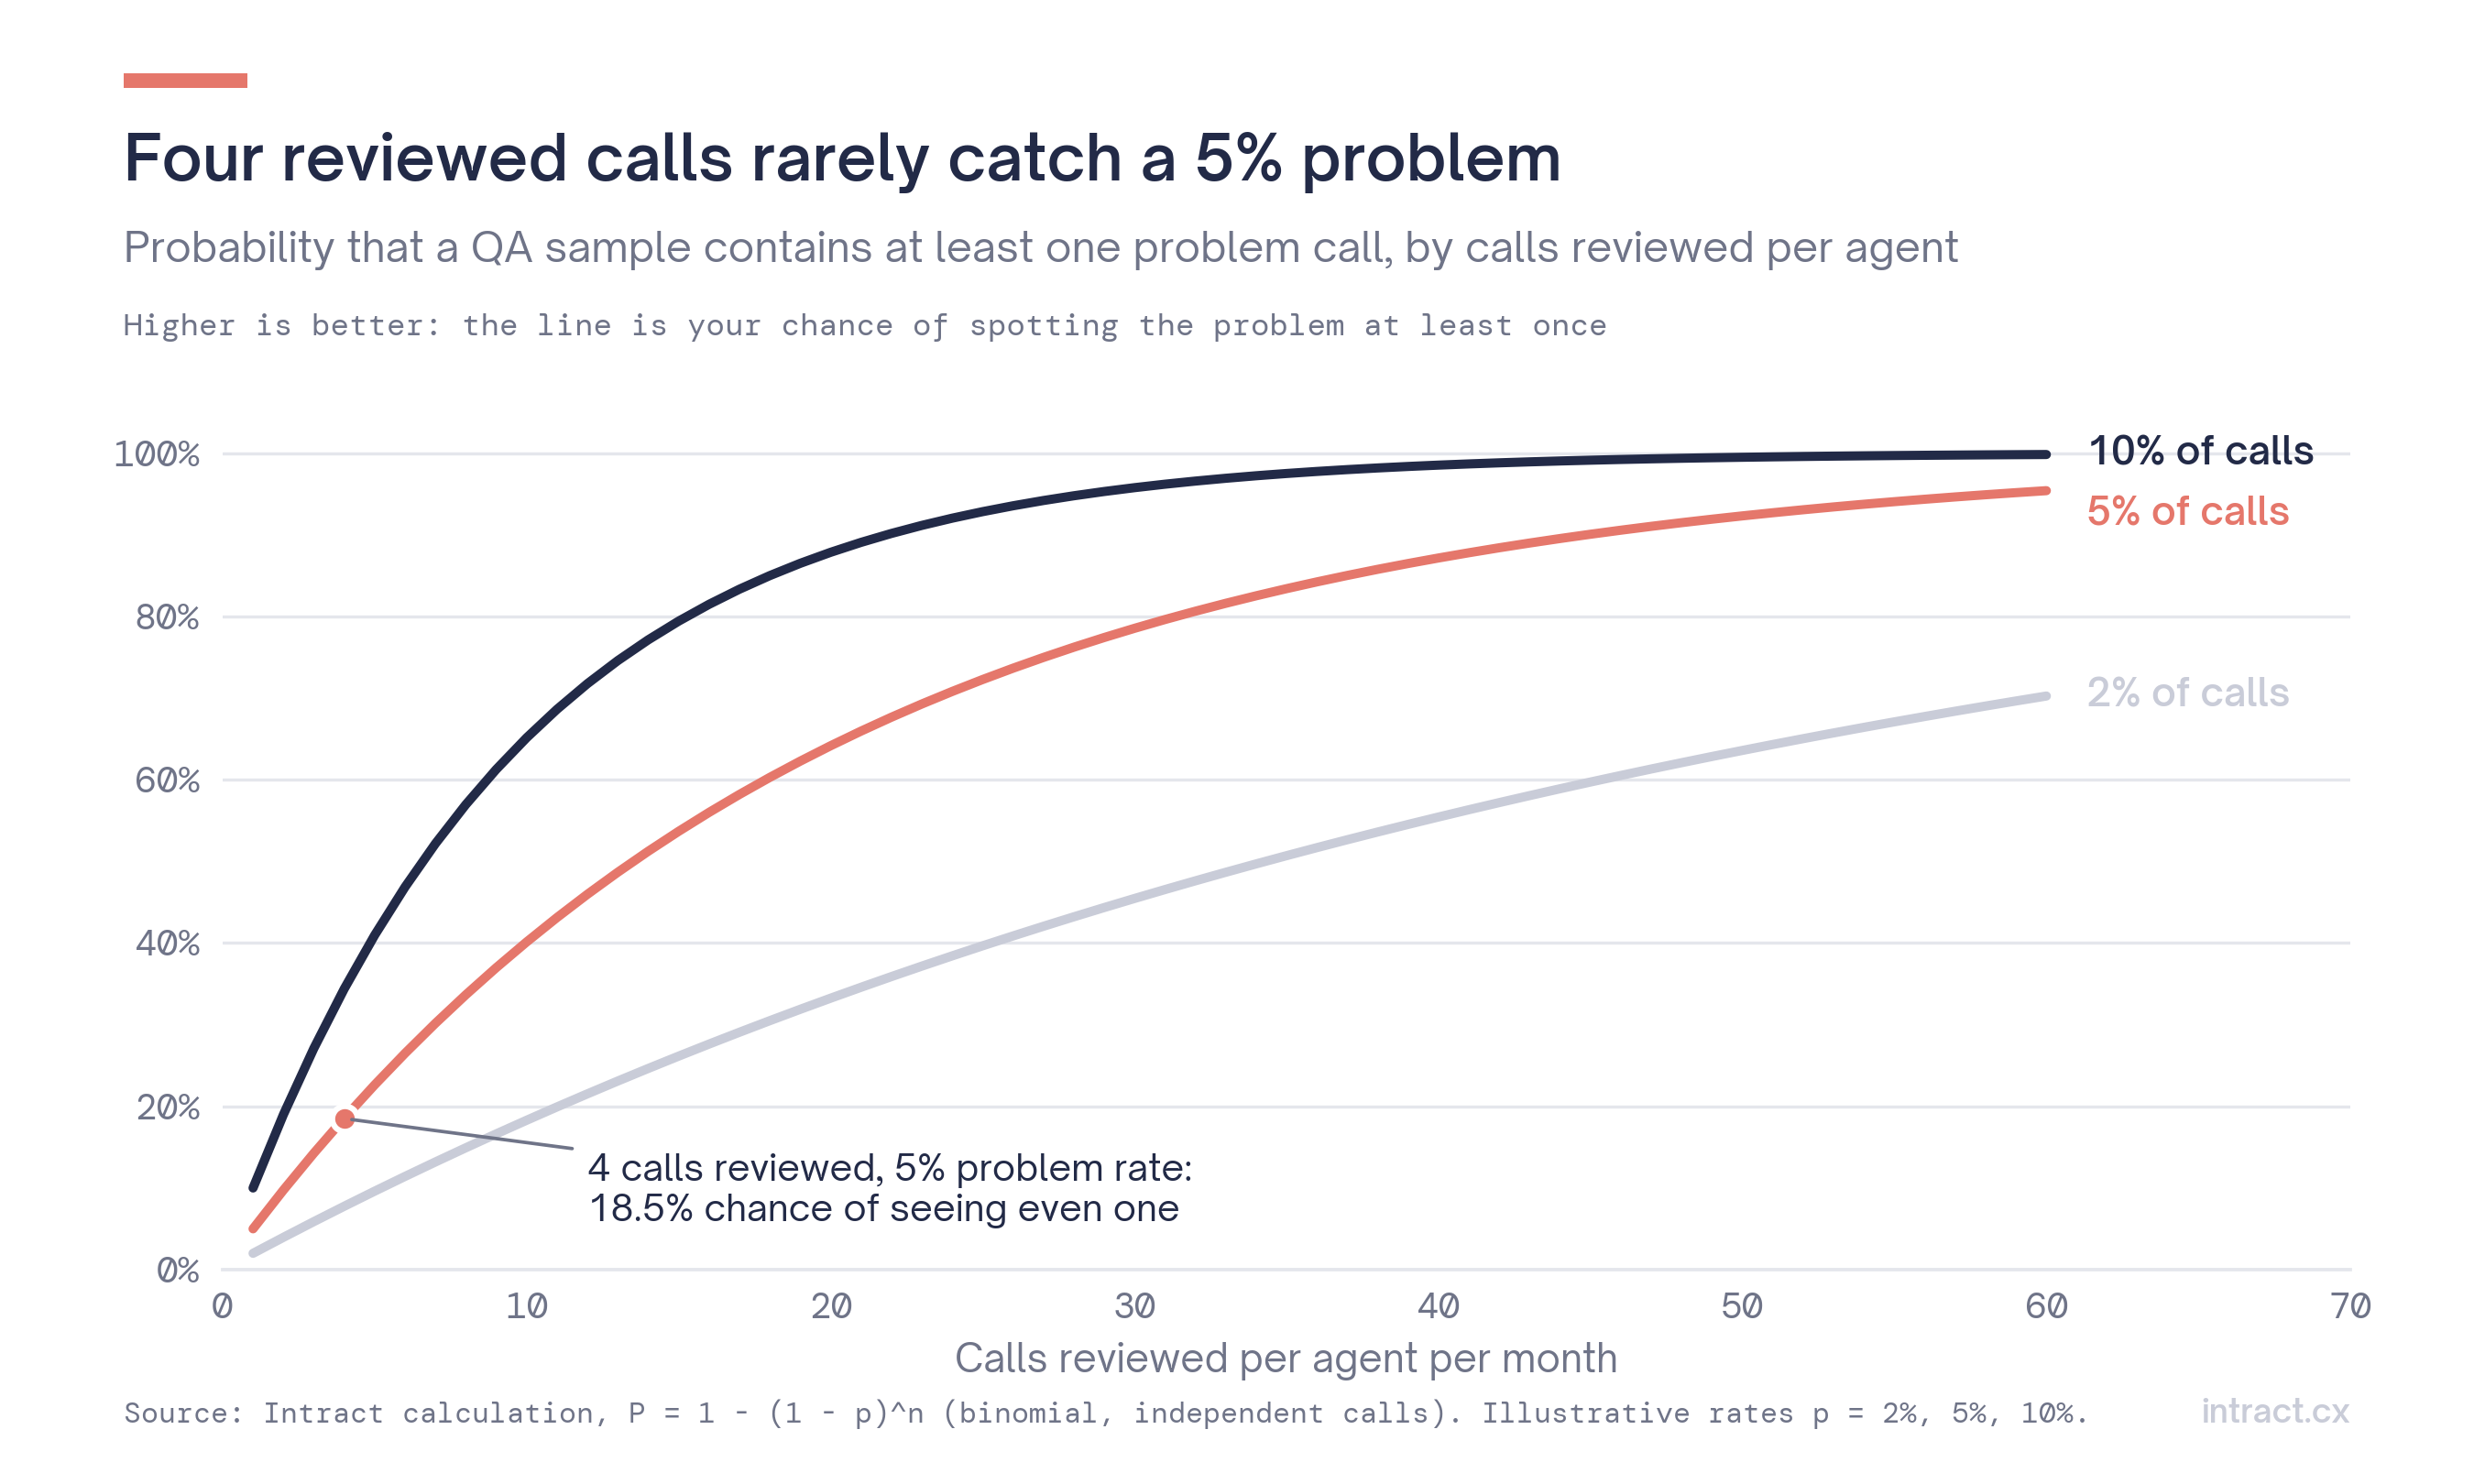 Figure 3. Reviewing 4 calls per agent catches a 5%-frequency problem 18.5% of the time.
| Problem frequency | 4 calls | 10 calls | 30 calls | 60 calls |
|---|---|---|---|---|
| 2% of calls | 7.8% | 18.3% | 45.5% | 70.2% |
| 5% of calls | 18.5% | 40.1% | 78.5% | 95.4% |
| 10% of calls | 34.4% | 65.1% | 95.8% | 99.8% |
Read the 5% row again. A problem in one call out of twenty, a frequency most compliance teams would consider serious, goes unseen in four months out of five for a typical agent.
4. What sampling does well
Sampling is not useless. It is a good instrument for two things:
- Centre-wide trends. For a proportion across the whole operation, the margin of error at 95% is about . Roughly 385 calls give ±5 points, which matches the ~400 calls practitioners cite for that precision.
- Coaching conversations. A reviewer listening to a call with an agent produces something no score does: context, tone, a concrete example to discuss. SQM reports that 71% of centres coach agents on four or more evaluated calls.
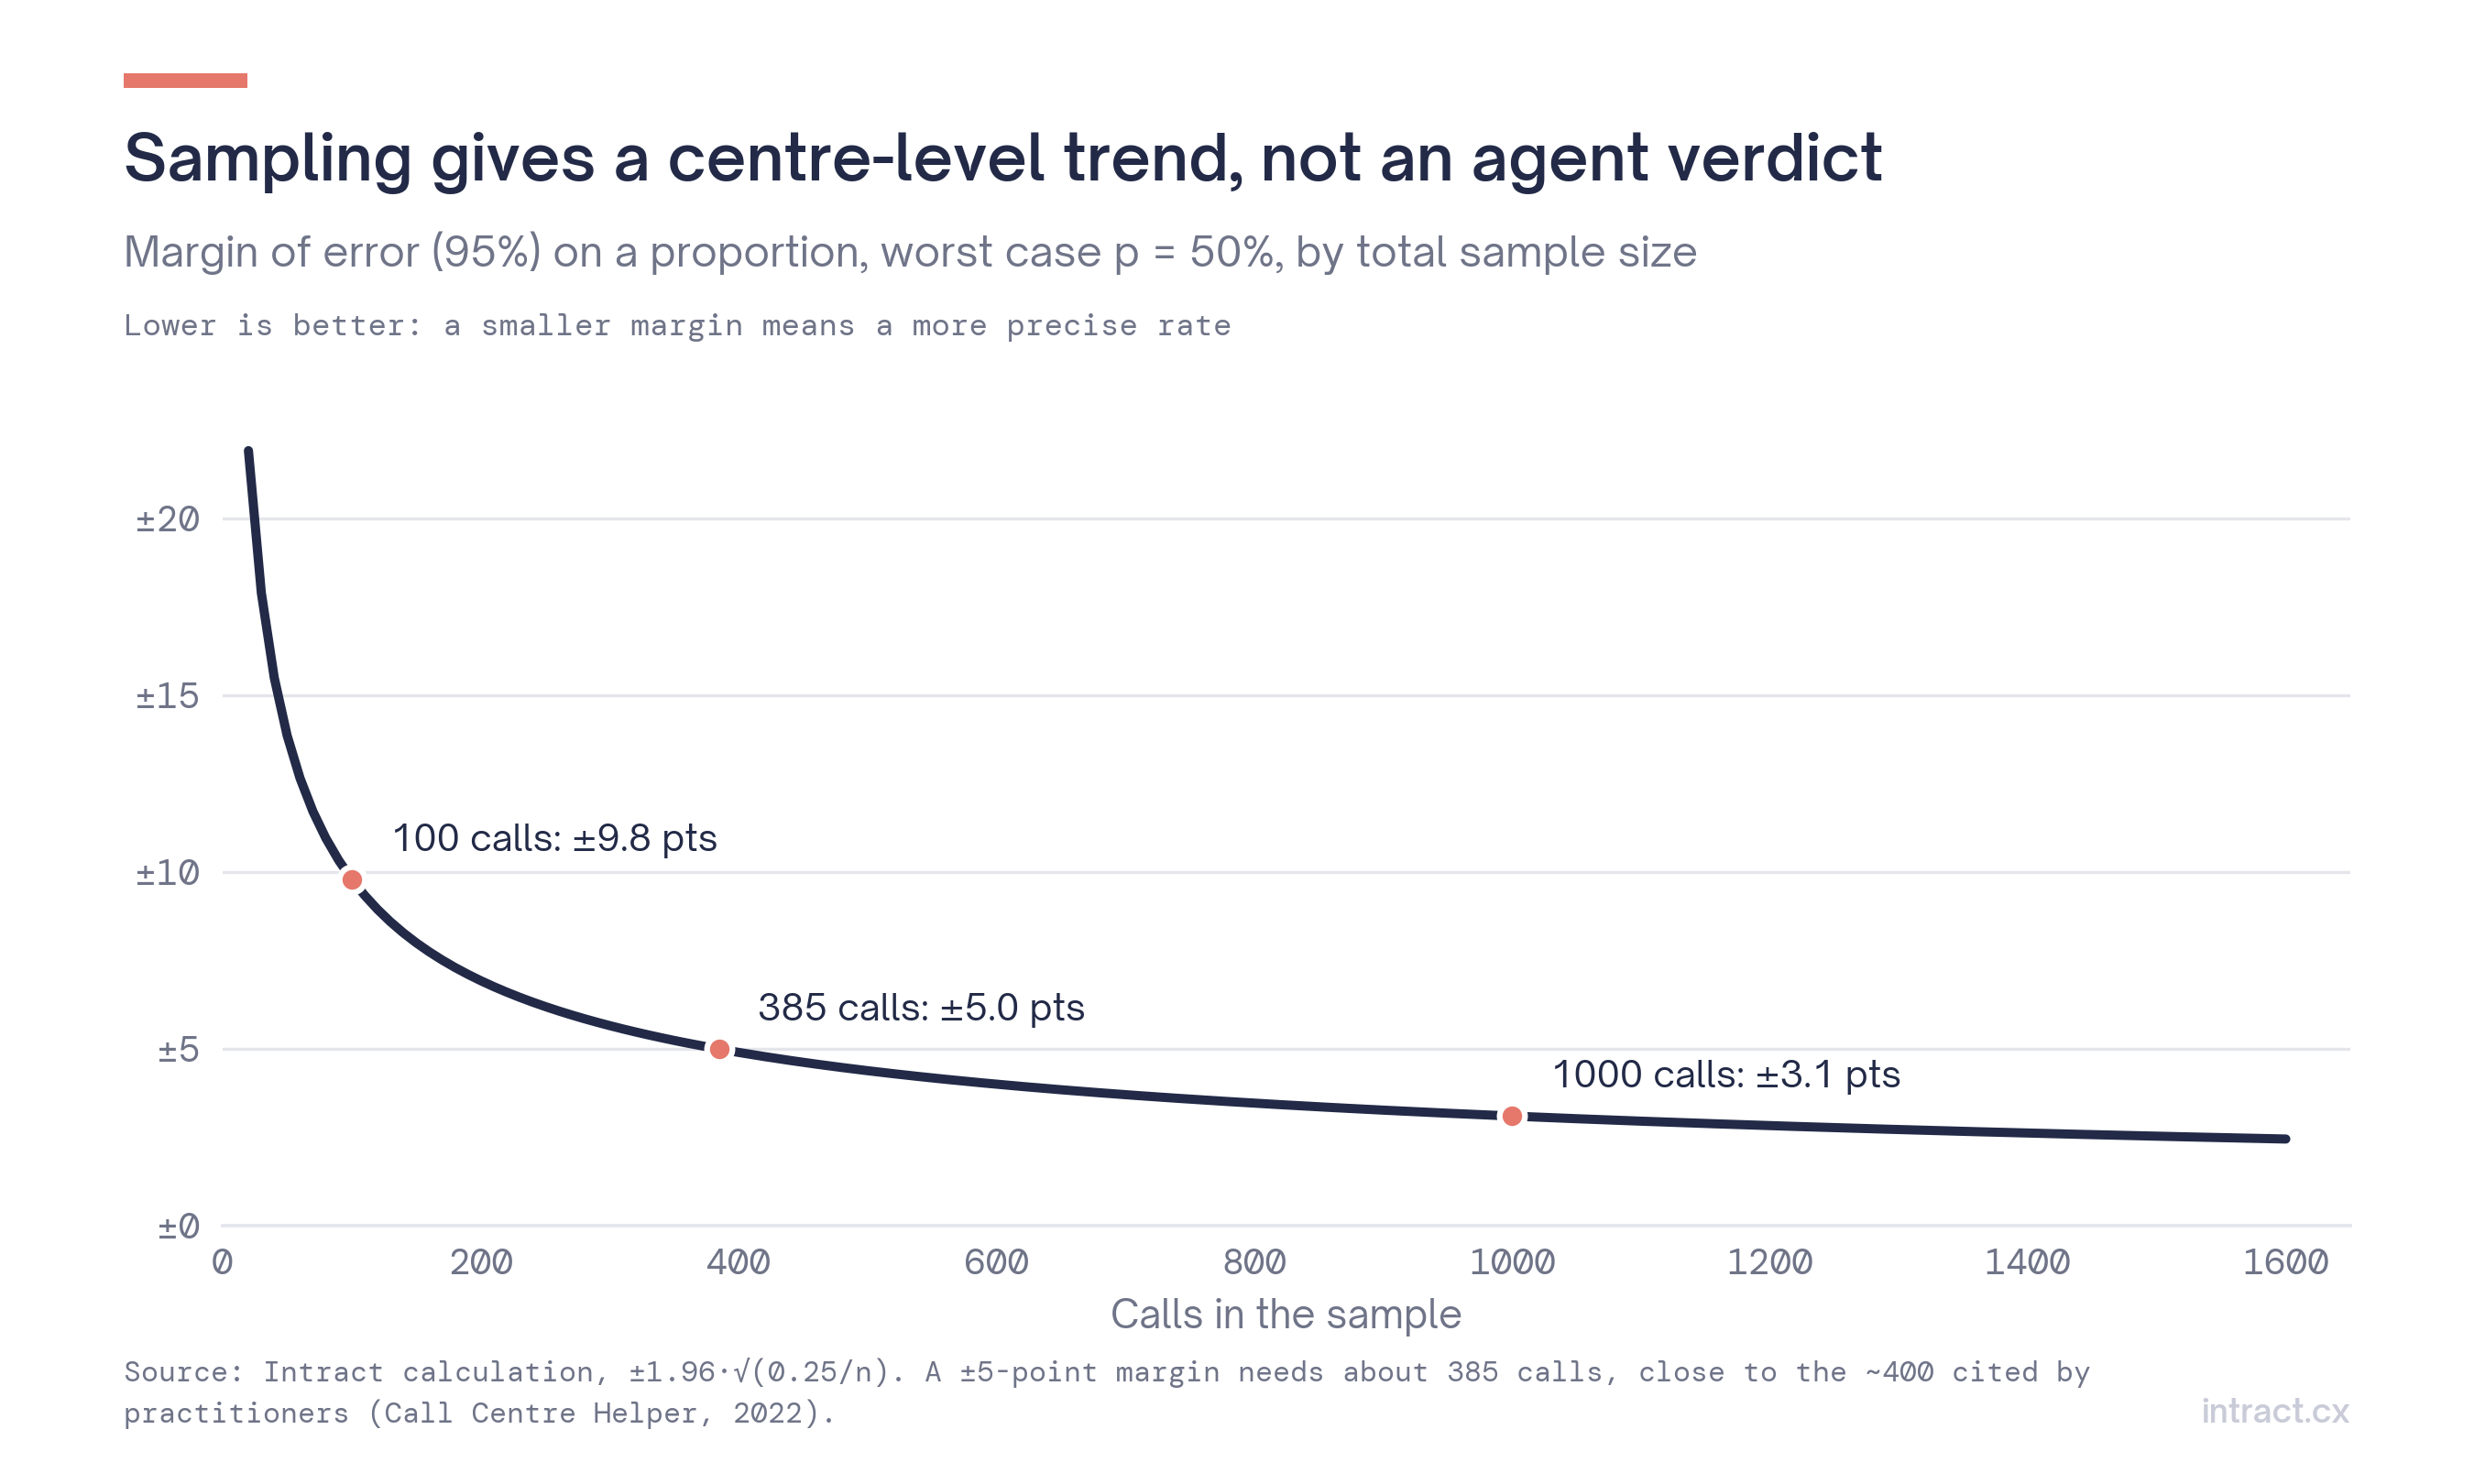 Figure 4. The centre-level margin of error shrinks quickly up to a few hundred calls, then flattens.
The trouble starts when a sample built for trends is used to judge individuals, or to prove that a rule was followed.
5. What 100% analysis changes
Analysing every call removes the sampling error entirely. What remains is the accuracy of the scoring itself, which you can measure.
| Question | Sampling (3–5 calls/agent) | 100% analysis |
|---|---|---|
| Centre-wide trend | Good with ~400 calls | Exact count |
| Agent-level compliance rate | ±30 points or worse | Limited only by scoring accuracy |
| Detecting a 5% problem for one agent in a month | ~1 in 5 chance | Every occurrence flagged |
| Where reviewers spend time | Random calls | Calls flagged as doubtful |
| Evidence for an auditor | A sample | Every call, scored |
Adoption is moving. In COPC's 2022 benchmark of large operations, 79% already used speech analytics for QA. That sample skews towards mature operations, so the wider market is lower, but the direction is clear.
6. A practical model: score everything, review the right calls
The goal is not to replace reviewers. It is to change what they listen to.
- Automate the objective checks on 100% of calls. "Was the price stated?", "Was the cooling-off period mentioned?" These are yes/no questions with a quote to justify the answer.
- Route doubtful calls to humans. Low-confidence scores, failed critical items, customer hesitation.
- Keep a small random sample for calibration and for issues nobody thought to automate.
- Coach on patterns, not anecdotes. "You miss the cooling-off mention on 30% of sales calls" is a better coaching conversation than "on this call, you forgot it".
How Intract supports this
Intract analyses every call it receives (natively from Aircall and Vonage, or through its Audio and Text APIs). Your QA grid becomes a no-code workflow: a structured AI step scores each question OK or not OK, with the transcript one click away; aggregation steps compute compliance rates and the number of misses, and the results become filterable columns and dashboards by team and period. Before publishing a grid, you can run it on a sample of recent calls and mark each answer right or wrong to get an accuracy score per column. Critical misses can trigger a Microsoft Teams alert.
In a pilot with a European consumer-credit lender, this approach was used to check an eight-question insurance sales script on 100% of calls.
FAQ
How many calls should we review per agent per month? For coaching, 3 to 5 well-chosen calls is a reasonable rhythm. For judging compliance, no small sample is enough: at 4 calls, an 80% score has a 95% interval of 34–97%.
Is a random sample better than a chosen one? Random samples avoid bias but waste time on routine calls. Once every call is scored automatically, choose calls on purpose (failed critical items, low confidence) and keep a small random sample for calibration.
Does 100% analysis replace our QA team? No. It removes the counting and points reviewers to the calls that need judgement.
Methodology and sources
Calculations (Intract). Detection probability: , assuming independent calls. Confidence intervals: Wilson score interval, . Margin of error: , worst case . All figures can be reproduced in a spreadsheet.
Sources.
- Gartner, Evaluate 100% of Service Interactions With Auto QA (2026)
- SQM Group, Call center quality assurance tips
- COPC, Global Benchmarking Series 2022: Contact Center Quality Assurance
- Call Centre Helper, QA staff to agent ratio and Number of calls analysed (2022)
- ICMI, Three essential quality management metrics (2020)
- Solidroad State of CX 2026, via Stacker (vendor survey, 500 agents)